Platform paper social experiment analysis: Part 2#
This guide continues the behavioural data analysis from experiments social0.2, social0.3, and social0.4, introduced in Platform paper social experiment analysis: Part 1, where we outlined the experimental design and provided provided setup instructions for running the analysis.
Here, we assume the environment is already active and focus on comparing solo and social behaviours—specifically exploration, sleep, foraging, and drinking—as well as solo and social learning, including changes in foraging efficiency over time and patch preference, quantified as the probability of being in the poor patch.
See also
DataJoint pipeline: Fetching data as DataFrames and DataJoint pipeline: Computing behavioural bouts for details on how we quantify exploration, sleep, foraging, and drinking bouts based on position data.
Import libraries and define variables and helper functions#
from pathlib import Path

import matplotlib.pyplot as plt
import numpy as np
import pandas as pd
import seaborn as sns
from scipy import stats
from scipy.ndimage import uniform_filter1d
from tqdm.auto import tqdm
The hidden cells below define helper functions, constants, and setup variables used throughout the notebook. They must be run, but are hidden for readability.
# CHANGE THIS TO THE PATH WHERE
# YOUR LOCAL DATASET (PARQUET FILES) IS STORED
data_dir = Path("")
Solo vs. social behaviours#
Exploring#
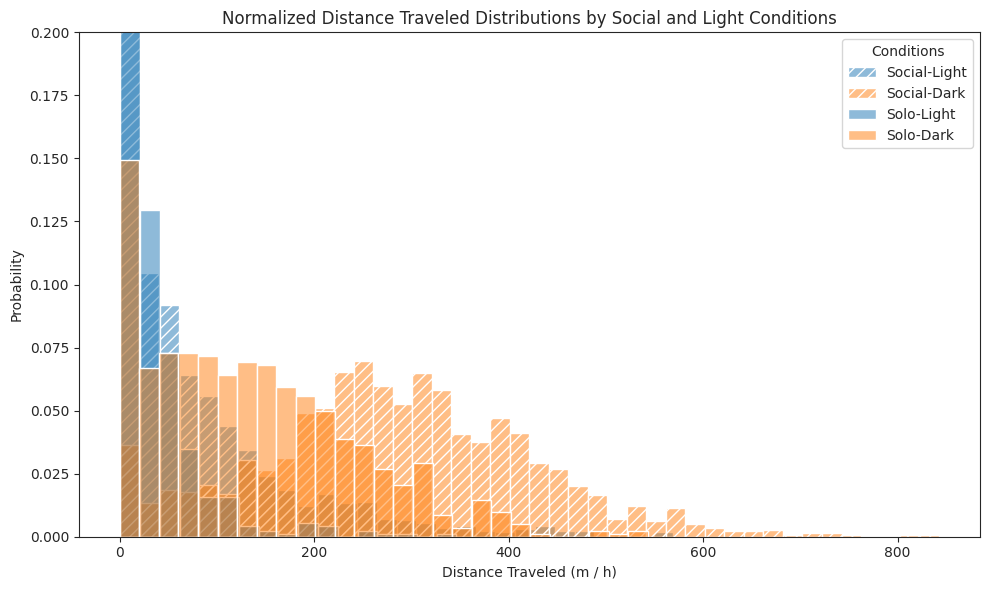
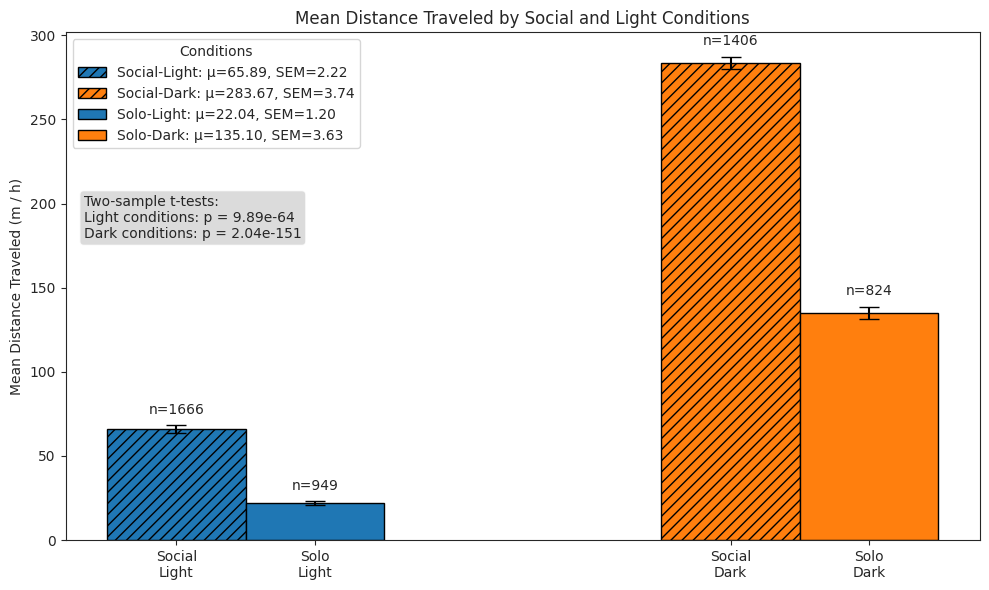
We compare subjects’ exploratory behaviour in solo and social conditions across light and dark cycles, and show that subjects in the social condition exhibit a stronger exploratory drive, covering greater distances.
Distance travelled#
This hidden cell is optional. It performs per-subject hourly distance computations across all experiments and periods based on multi-animal tracking data. As the computations are slow, we have precomputed the results and saved them to Parquet.
Here we will load and visualise the precomputed distances from the aforementioned Parquet file.
# Load the parquet file
dist_trav_hour_df = pd.read_parquet(
    data_dir / "for_plots" / "dist_trav_hour_df.parquet",
    engine="pyarrow",
)
dist_trav_hour_df.head()
| hour | distance | exp | social | subject | light | |
|---|---|---|---|---|---|---|
| 0 | 2024-01-31 11:00:00 | 214.375787 | social0.2-aeon3 | False | BAA-1104045 | False |
| 1 | 2024-01-31 12:00:00 | 358.672416 | social0.2-aeon3 | False | BAA-1104045 | False |
| 2 | 2024-01-31 13:00:00 | 301.952548 | social0.2-aeon3 | False | BAA-1104045 | False |
| 3 | 2024-01-31 14:00:00 | 284.154738 | social0.2-aeon3 | False | BAA-1104045 | False |
| 4 | 2024-01-31 15:00:00 | 420.268372 | social0.2-aeon3 | False | BAA-1104045 | False |
# Plot histograms for each combination
fig, ax = plt.subplots(figsize=(10, 6))
for i, (social_val, light_val) in enumerate(combos):
    # Filter data for this combination
    subset = dist_trav_hour_df[
        (dist_trav_hour_df["social"] == social_val)
        & (dist_trav_hour_df["light"] == light_val)
    ]
    # Plot normalized histogram
    hist = sns.histplot(
        data=subset,
        x="distance",
        stat="probability",  # This normalizes the histogram
        alpha=0.5,
        color=colors[light_val],
        label=labels[i],
        # kde=True,  # Add kernel density estimate
        common_norm=False,  # Ensure each histogram is normalized separately
        axes=ax,
        binwidth=20,
    )
    # Set hatch pattern for bars
    if hatches[social_val]:
        for bar in hist.patches:
            bar.set_hatch(hatches[social_val])

ax.set_title(
    "Normalized Distance Traveled Distributions by Social and Light Conditions"
)
ax.set_xlabel("Distance Traveled (m / h)")
ax.set_ylabel("Probability")
ax.legend(title="Conditions")
ax.set_ylim(0, 0.2)
plt.tight_layout()
plt.show()
# Plot bar plot of means
fig, ax = plt.subplots(figsize=(10, 6))
summary_data = []
for social_val in [True, False]:
    for light_val in [True, False]:
        subset = dist_trav_hour_df[
            (dist_trav_hour_df["social"] == social_val)
            & (dist_trav_hour_df["light"] == light_val)
        ]
        mean_dist = subset["distance"].mean()
        sem_dist = subset["distance"].sem()
        n_samples = len(subset)
        summary_data.append(
            {
                "social": social_val,
                "light": light_val,
                "mean_distance": mean_dist,
                "sem": sem_dist,
                "condition": (
                    f"{'Social' if social_val else 'Solo'}-"
                    f"{'Light' if light_val else 'Dark'}",
                ),
                "n": n_samples,
            }
        )
summary_df = pd.DataFrame(summary_data)
# Set up positions for the bars
bar_width = 0.5
x_pos = np.array([0.25, 2.25, 0.75, 2.75])  # create two groups with a gap in the middle
# Plot bars
for i, row in enumerate(summary_data):
    pos = x_pos[i]
    social_val = row["social"]
    light_val = row["light"]
    bar = ax.bar(
        pos,
        row["mean_distance"],
        bar_width,
        yerr=row["sem"],
        color=colors[light_val],
        edgecolor="black",
        capsize=7,
        label=f"{row['condition'][0]}: μ={row['mean_distance']:.2f}, SEM={row['sem']:.2f}",
    )
    # Apply hatching for social conditions
    if hatches[social_val]:
        bar[0].set_hatch(hatches[social_val])
    # Add sample size as text above each bar
    sample_size_txt = ax.text(
        pos,
        row["mean_distance"] + row["sem"] + 5,
        f"n={row['n']}",
        ha="center",
        va="bottom",
    )

ax.set_ylabel("Mean Distance Traveled (m / h)")
ax.set_xticks(x_pos)
ax.set_xticklabels(["Social\nLight", "Social\nDark", "Solo\nLight", "Solo\nDark"])
ax.set_title("Mean Distance Traveled by Social and Light Conditions")
ax.legend(title="Conditions", loc="upper left")
# Add stats tests
light_social = dist_trav_hour_df.query("social and light")["distance"]
light_solo = dist_trav_hour_df.query("not social and light")["distance"]
dark_social = dist_trav_hour_df.query("social and not light")["distance"]
dark_solo = dist_trav_hour_df.query("not social and not light")["distance"]
light_stat, light_p = stats.ttest_ind(
    light_social, light_solo, alternative="two-sided", equal_var=False
)
dark_stat, dark_p = stats.ttest_ind(
    dark_social, dark_solo, alternative="two-sided", equal_var=False
)
test_text = (
    f"Two-sample t-tests:\n"
    f"Light conditions: p = {light_p:.2e}\nDark conditions: p = {dark_p:.2e}"
)
props = dict(boxstyle="round,pad=0.3", facecolor="lightgray", alpha=0.8)
ax.text(
    0.02,
    0.68,  # Position below the legend
    test_text,
    transform=ax.transAxes,
    verticalalignment="top",
    bbox=props,
)
plt.tight_layout()
plt.show()
Bouts#
# Final df:
# rows = hour-datetime,
# columns = n_bouts, exp, social-bool, subject, light-bool
explore_hour_df = pd.DataFrame(
    {
        "hour": pd.Series(dtype="datetime64[ns]"),
        "n_bouts": pd.Series(dtype="int"),
        "exp": pd.Series(dtype="string"),
        "social": pd.Series(dtype="bool"),
        "subject": pd.Series(dtype="string"),
        "light": pd.Series(dtype="bool"),
    }
)
explore_dur_df = pd.DataFrame(
    {
        "start": pd.Series(dtype="datetime64[ns]"),
        "duration": pd.Series(dtype="timedelta64[ns]"),
        "exp": pd.Series(dtype="string"),
        "social": pd.Series(dtype="bool"),
        "subject": pd.Series(dtype="string"),
        "light": pd.Series(dtype="bool"),
    }
)

exp_pbar = tqdm(experiments, desc="Experiments", position=0, leave=True)
for exp in exp_pbar:
    period_pbar = tqdm(periods, desc="Periods", position=1, leave=False)
    for period in period_pbar:
        explore_bouts_df = load_data_from_parquet(
            experiment_name=exp["name"],
            period=period,
            data_type="explore",
            data_dir=data_dir,
            set_time_index=True,
        )
        for subject in explore_bouts_df["subject"].unique():
            explore_df_subj = explore_bouts_df[explore_bouts_df["subject"] == subject]
            explore_df_subj["hour"] = explore_df_subj["start"].dt.floor("h")
            min_hour, max_hour = (
                explore_df_subj["hour"].min(),
                explore_df_subj["hour"].max(),
            )
            complete_hours = pd.DataFrame(
                {"hour": pd.date_range(start=min_hour, end=max_hour, freq="h")}
            )
            hour_counts = (
                explore_df_subj.groupby("hour").size().reset_index(name="n_bouts")
            )
            explore_df_subj_hour = pd.merge(
                complete_hours, hour_counts, on="hour", how="left"
            ).fillna(0)
            explore_df_subj_hour["n_bouts"] = explore_df_subj_hour["n_bouts"].astype(
                int
            )
            explore_df_subj_hour["exp"] = exp["name"]
            explore_df_subj_hour["social"] = period == "social"
            explore_df_subj_hour["subject"] = subject
            hour = explore_df_subj_hour["hour"].dt.hour
            explore_df_subj_hour["light"] = ~((hour > light_off) & (hour < light_on))
            explore_hour_df = pd.concat(
                [explore_hour_df, explore_df_subj_hour], ignore_index=True
            )
            explore_dur_subj = explore_df_subj[["start", "duration"]].copy()
            explore_dur_subj["exp"] = exp["name"]
            explore_dur_subj["social"] = period == "social"
            explore_dur_subj["subject"] = subject
            hour = explore_dur_subj["start"].dt.hour
            explore_dur_subj["light"] = ~((hour > light_off) & (hour < light_on))
            explore_dur_df = pd.concat(
                [explore_dur_df, explore_dur_subj], ignore_index=True
            )

explore_dur_df["duration"] = explore_dur_df["duration"].dt.total_seconds() / 60
explore_dur_df = explore_dur_df[explore_dur_df["duration"] < 120]
explore_hour_df.head()
| hour | n_bouts | exp | social | subject | light | |
|---|---|---|---|---|---|---|
| 0 | 2024-02-09 16:00:00 | 8 | social0.2-aeon3 | True | BAA-1104045 | False |
| 1 | 2024-02-09 17:00:00 | 8 | social0.2-aeon3 | True | BAA-1104045 | False |
| 2 | 2024-02-09 18:00:00 | 7 | social0.2-aeon3 | True | BAA-1104045 | False |
| 3 | 2024-02-09 19:00:00 | 4 | social0.2-aeon3 | True | BAA-1104045 | False |
| 4 | 2024-02-09 20:00:00 | 3 | social0.2-aeon3 | True | BAA-1104045 | True |
explore_dur_df.head()
| start | duration | exp | social | subject | light | |
|---|---|---|---|---|---|---|
| 0 | 2024-02-09 16:10:02.960 | 1.0 | social0.2-aeon3 | True | BAA-1104045 | False |
| 1 | 2024-02-09 16:17:02.960 | 1.0 | social0.2-aeon3 | True | BAA-1104045 | False |
| 2 | 2024-02-09 16:19:02.960 | 5.0 | social0.2-aeon3 | True | BAA-1104045 | False |
| 3 | 2024-02-09 16:25:02.960 | 13.0 | social0.2-aeon3 | True | BAA-1104045 | False |
| 4 | 2024-02-09 16:39:02.960 | 1.0 | social0.2-aeon3 | True | BAA-1104045 | False |
# Plot hist of bouts per hour
fig, ax = plt.subplots(figsize=(10, 6))
# Plot histograms for each combination
for i, (social_val, light_val) in enumerate(combos):
subset = explore_hour_df[
(explore_hour_df["social"] == social_val)
& (explore_hour_df["light"] == light_val)
]
# Plot normalized histogram
hist = sns.histplot(
data=subset,
x="n_bouts",
stat="probability",
alpha=0.5,
color=colors[light_val],
label=labels[i],
common_norm=False, # Ensure each histogram is normalized separately
axes=ax,
binwidth=1,
)
# Set hatch pattern for bars
if hatches[social_val]:
for bar in hist.patches:
bar.set_hatch(hatches[social_val])
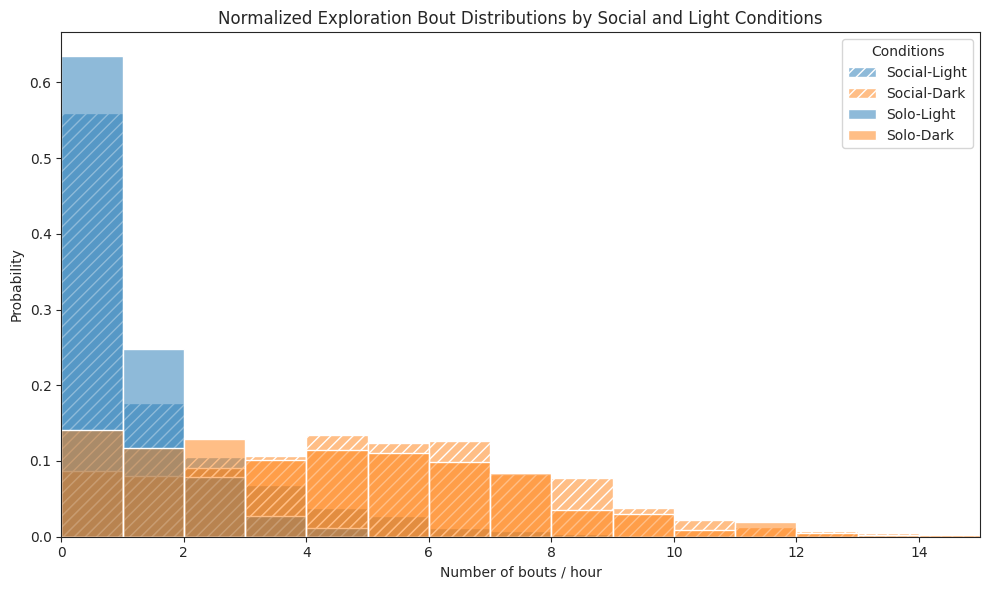
ax.set_title("Normalized Exploration Bout Distributions by Social and Light Conditions")
ax.set_xlabel("Number of bouts / hour")
ax.set_ylabel("Probability")
ax.legend(title="Conditions")
ax.set_xticks(np.arange(0, 15, 2))
ax.set_xlim(0, 15)
plt.tight_layout()
plt.show()
# Plot bars of bouts per hour
fig, ax = plt.subplots(figsize=(10, 6))
summary_data = []
for social_val in [True, False]:
for light_val in [True, False]:
subset = explore_hour_df[
(explore_hour_df["social"] == social_val)
& (explore_hour_df["light"] == light_val)
]
mean_n_bouts = subset["n_bouts"].mean()
sem_n_bouts = subset["n_bouts"].sem()
n_samples = len(subset)
summary_data.append(
{
"social": social_val,
"light": light_val,
"mean_n_bouts": mean_n_bouts,
"sem": sem_n_bouts,
"condition": f"{'Social' if social_val else 'Solo'}-{'Light' if light_val else 'Dark'}",
"n": n_samples,
}
)
summary_df = pd.DataFrame(summary_data)
# Set up positions for the bars
bar_width = 0.5
x_pos = np.array([0.25, 2.25, 0.75, 2.75]) # create two groups with a gap in the middle
# Plot bars
for i, row in enumerate(summary_data):
pos = x_pos[i]
social_val = row["social"]
light_val = row["light"]
bar = ax.bar(
pos,
row["mean_n_bouts"],
bar_width,
yerr=row["sem"],
color=colors[light_val],
edgecolor="black",
capsize=7,
label=row["condition"],
)
# Apply hatching for social conditions
if hatches[social_val]:
bar[0].set_hatch(hatches[social_val])
# Add sample size as text above each bar
sample_size_txt = ax.text(
pos,
row["mean_n_bouts"] + row["sem"] + 0.1,
f"n={row['n']}",
ha="center",
va="bottom",
)
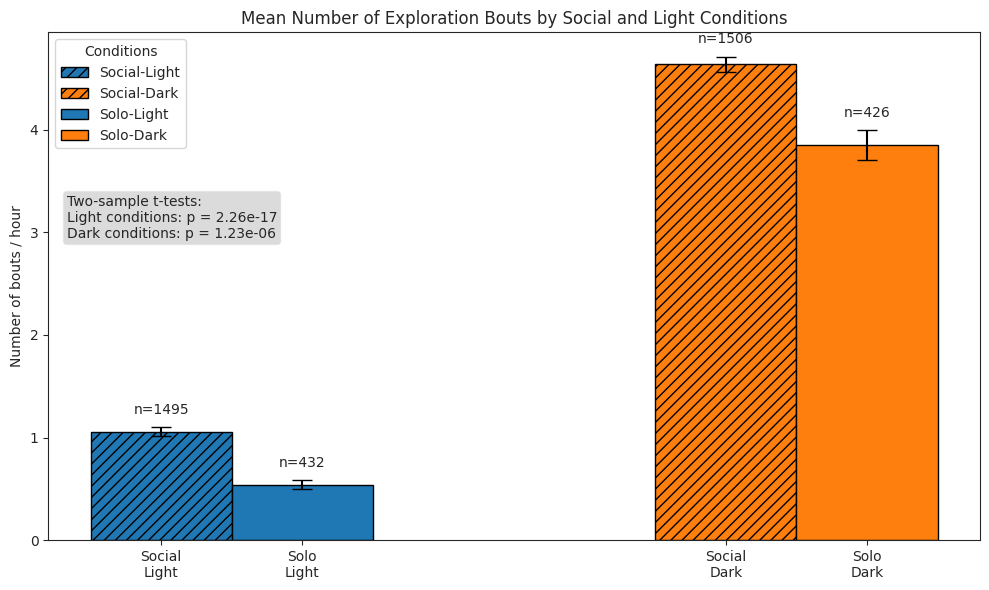
ax.set_title("Mean Number of Exploration Bouts by Social and Light Conditions")
ax.set_ylabel("Number of bouts / hour")
ax.set_xticks(x_pos)
ax.set_xticklabels(["Social\nLight", "Social\nDark", "Solo\nLight", "Solo\nDark"])
ax.legend(title="Conditions", loc="upper left")
# Perform Wilcoxon rank sum tests (Mann-Whitney U)
light_social = explore_hour_df.query("social and light")["n_bouts"]
light_solo = explore_hour_df.query("not social and light")["n_bouts"]
dark_social = explore_hour_df.query("social and not light")["n_bouts"]
dark_solo = explore_hour_df.query("not social and not light")["n_bouts"]
light_stat, light_p = stats.ttest_ind(
light_social, light_solo, alternative="two-sided", equal_var=False
)
dark_stat, dark_p = stats.ttest_ind(
dark_social, dark_solo, alternative="two-sided", equal_var=False
)
test_text = (
f"Two-sample t-tests:\n"
f"Light conditions: p = {light_p:.2e}\nDark conditions: p = {dark_p:.2e}"
)
props = dict(boxstyle="round,pad=0.3", facecolor="lightgray", alpha=0.8)
ax.text(
0.02,
0.68, # Position below the legend
test_text,
transform=ax.transAxes,
verticalalignment="top",
bbox=props,
)
plt.tight_layout()
plt.show()
# Plot histograms of durations of bouts for each combination
fig, ax = plt.subplots(figsize=(10, 6))
for i, (social_val, light_val) in enumerate(combos):
subset = explore_dur_df[
(explore_dur_df["social"] == social_val)
& (explore_dur_df["light"] == light_val)
]
# Plot normalized histogram
hist = sns.histplot(
data=subset,
x="duration",
stat="probability",
alpha=0.5,
color=colors[light_val],
label=labels[i],
# kde=True, # Add kernel density estimate
common_norm=False, # Ensure each histogram is normalized separately
axes=ax,
binwidth=2,
)
# Set hatch pattern for bars
if hatches[social_val]:
for bar in hist.patches:
bar.set_hatch(hatches[social_val])
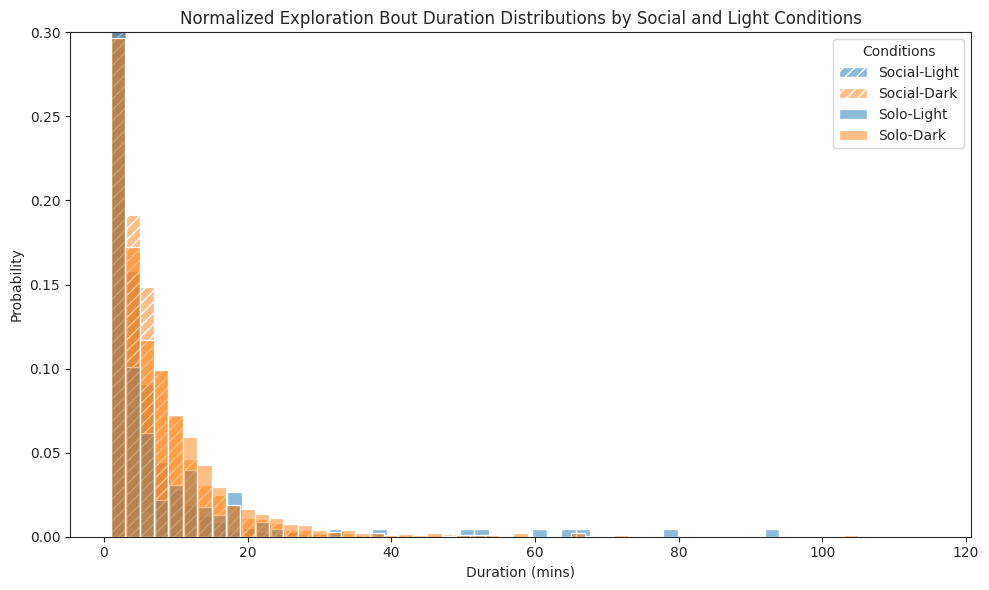
ax.set_title(
"Normalized Exploration Bout Duration Distributions by Social and Light Conditions"
)
ax.set_xlabel("Duration (mins)")
ax.set_ylabel("Probability")
ax.legend(title="Conditions")
ax.set_ylim(0, 0.3)
plt.tight_layout()
plt.show()
# Plot bars of durations of bouts
fig, ax = plt.subplots(figsize=(14, 8))
summary_data = []
for social_val in [True, False]:
for light_val in [True, False]:
subset = explore_dur_df[
(explore_dur_df["social"] == social_val)
& (explore_dur_df["light"] == light_val)
]
mean_duration = subset["duration"].mean()
sem_duration = subset["duration"].sem()
n_samples = len(subset)
summary_data.append(
{
"social": social_val,
"light": light_val,
"mean_duration": mean_duration,
"sem": sem_duration,
"condition": f"{'Social' if social_val else 'Solo'}-{'Light' if light_val else 'Dark'}",
"n": n_samples,
}
)
summary_df = pd.DataFrame(summary_data)
# Set up positions for the bars
bar_width = 0.5
x_pos = np.array([0.25, 2.25, 0.75, 2.75]) # create two groups with a gap in the middle
# Plot bars
for i, row in enumerate(summary_data):
pos = x_pos[i]
social_val = row["social"]
light_val = row["light"]
bar = ax.bar(
pos,
row["mean_duration"],
bar_width,
yerr=row["sem"],
color=colors[light_val],
edgecolor="black",
capsize=7,
label=row["condition"],
)
# Apply hatching for social conditions
if hatches[social_val]:
bar[0].set_hatch(hatches[social_val])
# Add sample size as text above each bar
sample_size_txt = ax.text(
pos,
row["mean_duration"] + row["sem"] + 0.2,
f"n={row['n']}",
ha="center",
va="bottom",
)
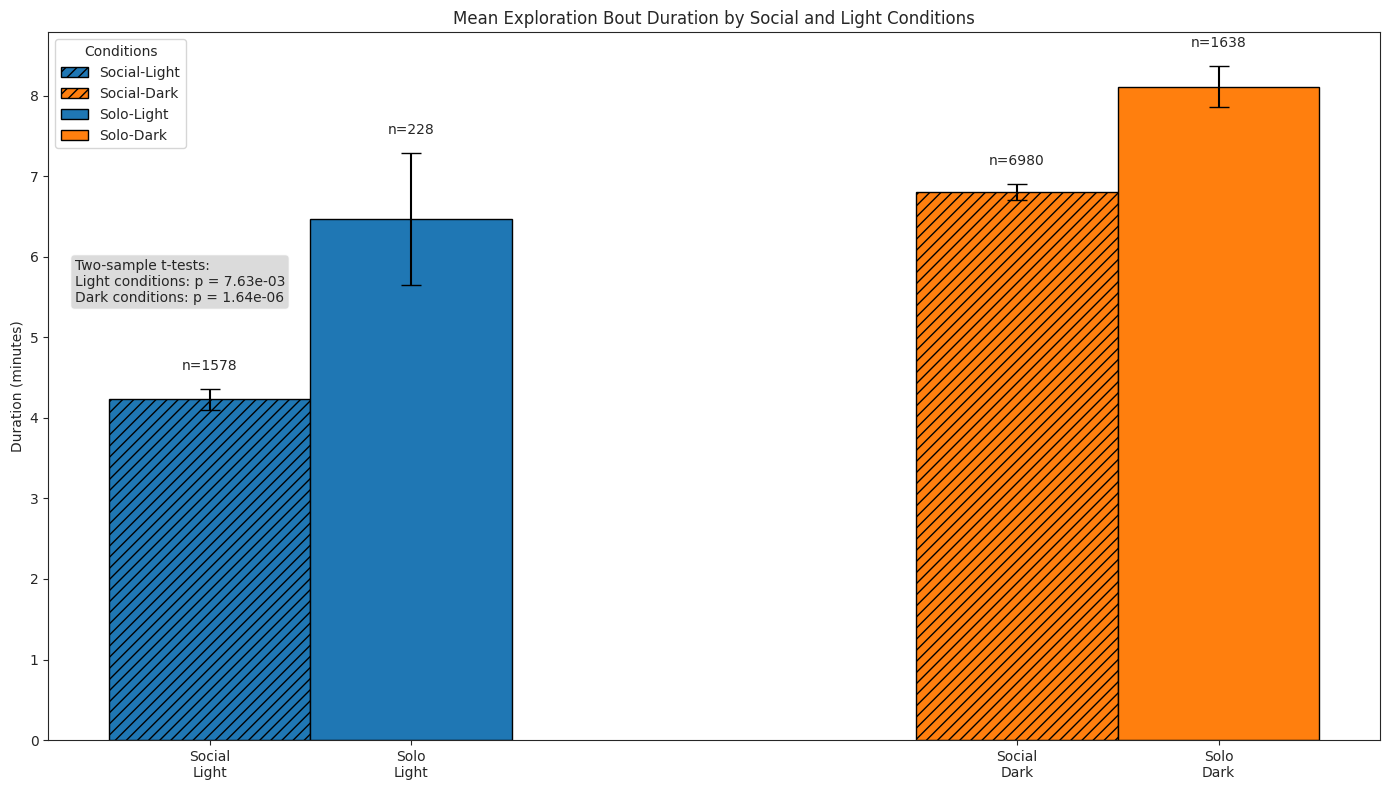
ax.set_title("Mean Exploration Bout Duration by Social and Light Conditions")
ax.set_ylabel("Duration (minutes)")
ax.set_xticks(x_pos)
ax.set_xticklabels(["Social\nLight", "Social\nDark", "Solo\nLight", "Solo\nDark"])
ax.legend(title="Conditions", loc="upper left")
# Perform Wilcoxon rank sum tests (Mann-Whitney U)
light_social = explore_dur_df.query("social and light")["duration"]
light_solo = explore_dur_df.query("not social and light")["duration"]
dark_social = explore_dur_df.query("social and not light")["duration"]
dark_solo = explore_dur_df.query("not social and not light")["duration"]
light_stat, light_p = stats.ttest_ind(
light_social, light_solo, alternative="two-sided", equal_var=False
)
dark_stat, dark_p = stats.ttest_ind(
dark_social, dark_solo, alternative="two-sided", equal_var=False
)
test_text = (
f"Two-sample t-tests:\n"
f"Light conditions: p = {light_p:.2e}\nDark conditions: p = {dark_p:.2e}"
)
props = dict(boxstyle="round,pad=0.3", facecolor="lightgray", alpha=0.8)
ax.text(
0.02,
0.68, # Position below the legend
test_text,
transform=ax.transAxes,
verticalalignment="top",
bbox=props,
)
plt.tight_layout()
plt.show()
# Plot histograms of times of bouts over all hours
fig, ax = plt.subplots(figsize=(14, 8))
for i, social_val in enumerate([True, False]):
    subset = explore_dur_df[(explore_dur_df["social"] == social_val)]
    # Create the histogram
    hist = sns.histplot(
        data=subset,
        x=subset["start"].dt.hour,
        stat="probability",  # Normalize to show probability
        alpha=0.5,
        color="teal",
        label="Social" if social_val else "Solo",
        common_norm=False,  # Each condition normalized separately
        ax=ax,
        bins=24,  # 24 hours
        discrete=True,  # Since hours are discrete values
    )
    # Apply hatching pattern for social conditions
    if hatches[social_val]:
        # Apply the hatch pattern to each bar
        for patch in hist.patches:
            patch.set_hatch(hatches[social_val])

# Set x-tick labels for every hour
ax.set_xticks(range(0, 24))
ax.set_xticklabels([f"{h:02d}:00" for h in range(0, 24)], rotation=45)
# Customize axis labels and title
ax.set_title("Distribution of Exploration Bouts Throughout the Day")
ax.set_xlabel("Hour of Day")
ax.set_ylabel("Probability")
ax.legend(title="Conditions")
plt.tight_layout()
plt.show()

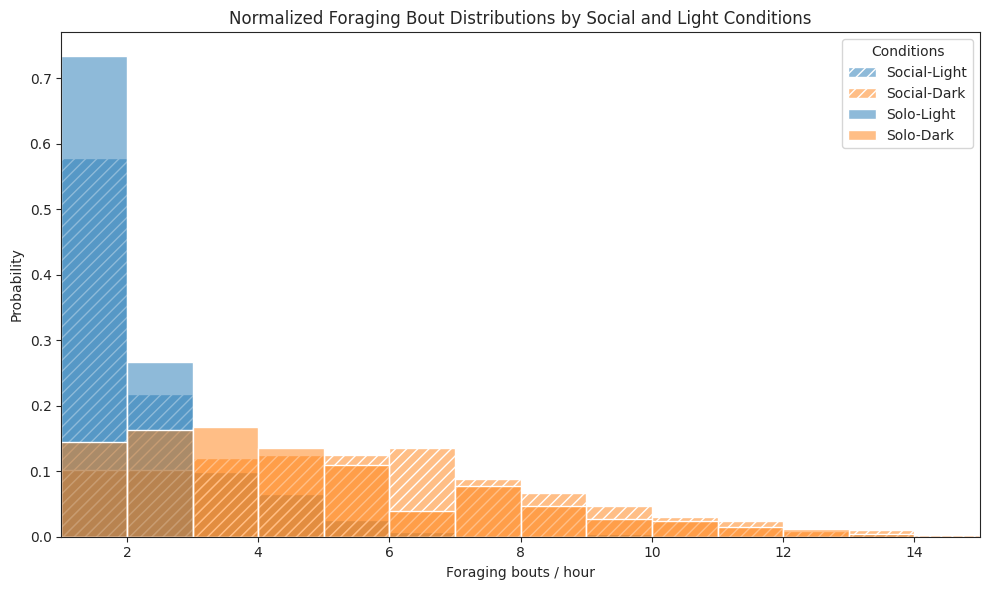
Foraging#
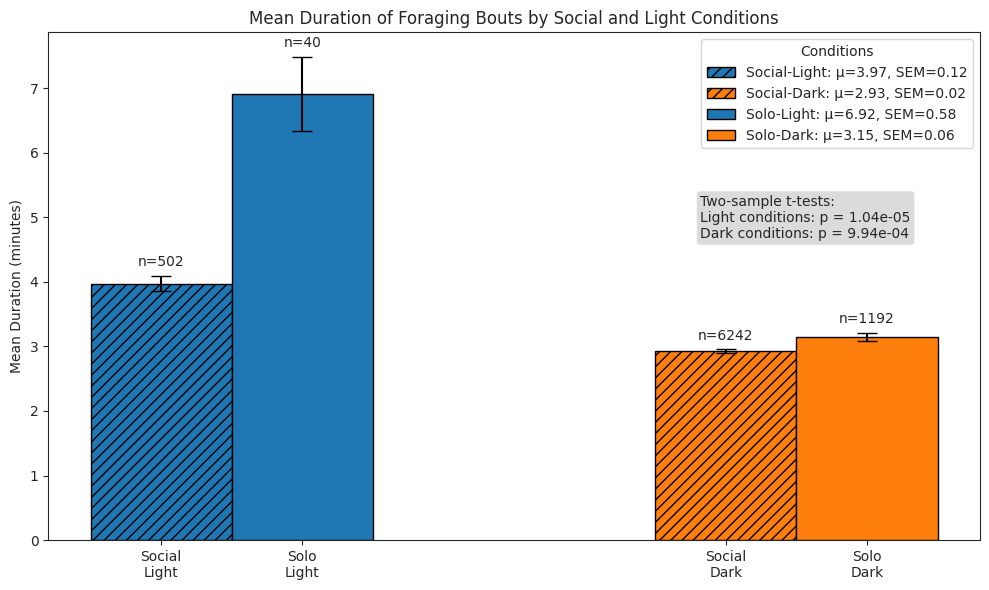
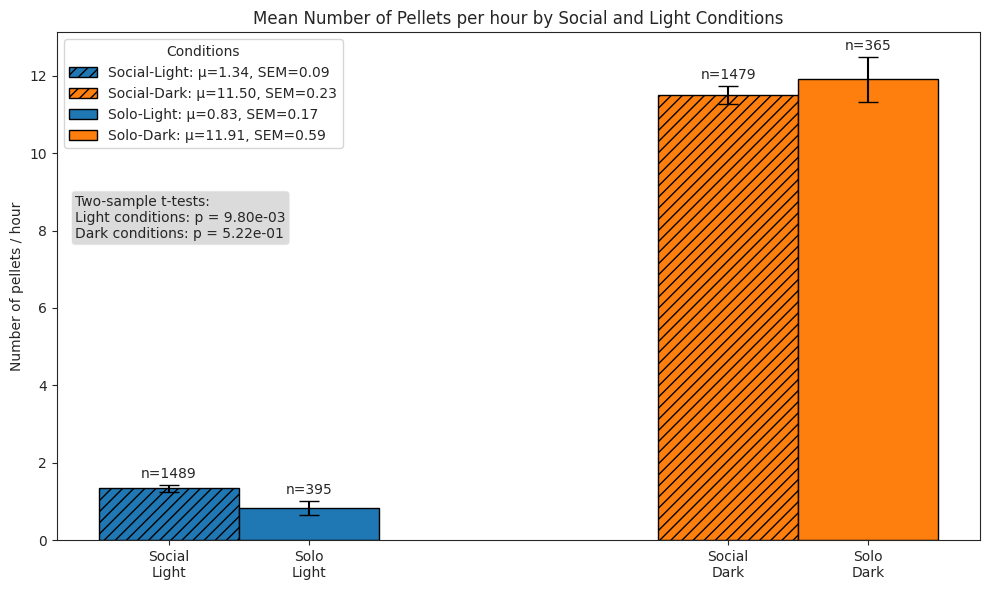
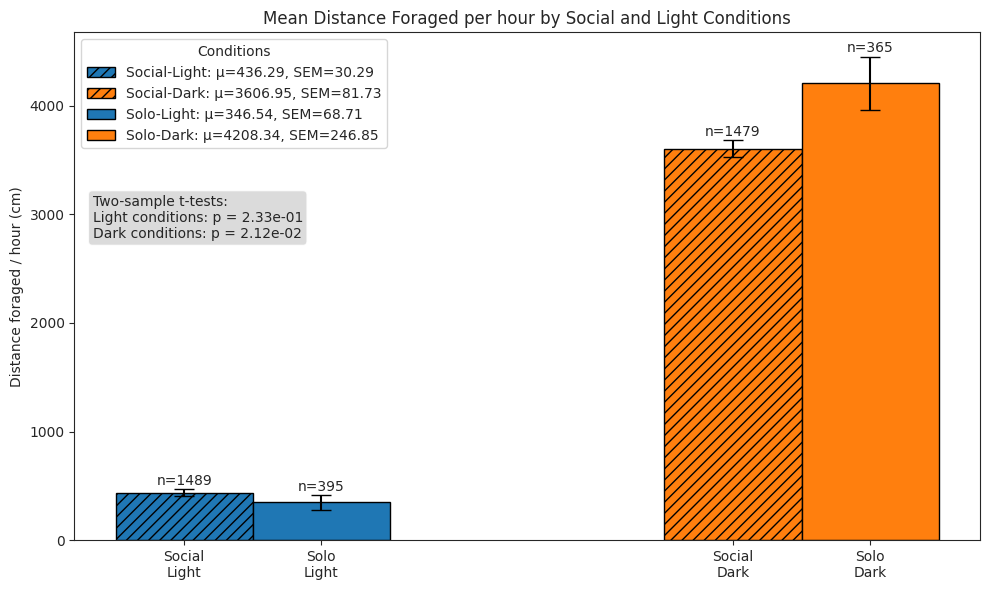
We compare subjects’ foraging behaviour in solo and social conditions across light and dark cycles, and show that subjects in the social condition engaged in more frequent but shorter foraging bouts, yielding a higher total pellet count than in the solo condition.
Notably, despite the increaed activity and pellet yield, the total distance spun on the foraging wheel was lower in the social condition, reflecting a shift towards more efficient foraging under social conditions.
# Final dfs:
# 1. forage_hour_df: hour, n_pellets, dist_forage, n_bouts, exp, social-bool, subject, light-bool
# 2. forage_dur_df: start, duration(mins), exp, social-bool, subject, light-bool
forage_hour_df = pd.DataFrame(
    {
        "hour": pd.Series(dtype="datetime64[ns]"),
        "n_bouts": pd.Series(dtype="int"),
        "n_pellets": pd.Series(dtype="int"),
        "dist_forage": pd.Series(dtype="float"),
        "exp": pd.Series(dtype="string"),
        "social": pd.Series(dtype="bool"),
        "subject": pd.Series(dtype="string"),
        "light": pd.Series(dtype="bool"),
    }
)
forage_dur_df = pd.DataFrame(
    {
        "start": pd.Series(dtype="datetime64[ns]"),
        "duration": pd.Series(dtype="float"),  # in minutes
        "exp": pd.Series(dtype="string"),
        "social": pd.Series(dtype="bool"),
        "subject": pd.Series(dtype="string"),
        "light": pd.Series(dtype="bool"),
    }
)
# For each period
# Load foraging data
# Split into individual dfs
# Calculate hour-by-hour metrics and put into final df
exp_pbar = tqdm(experiments, desc="Experiments", position=0, leave=True)
for exp in exp_pbar:
    period_pbar = tqdm(periods, desc="Periods", position=1, leave=False)
    for period in period_pbar:
        forage_df = load_data_from_parquet(
            experiment_name=exp["name"],
            period=period,
            data_type="foraging",
            data_dir=data_dir,
            set_time_index=True,
        )
        for subject in forage_df["subject"].unique():
            forage_df_subj = forage_df[forage_df["subject"] == subject]
            forage_df_subj["hour"] = forage_df_subj["start"].dt.floor("h")
            hour_counts = pd.merge(
                forage_df_subj.groupby("hour").size().reset_index(name="n_bouts"),
                forage_df_subj.groupby("hour").agg(
                    n_pellets=("n_pellets", "sum"),
                    cum_wheel_dist=("cum_wheel_dist", "sum"),
                ),
                on="hour",
                how="left",
            )
            min_hour, max_hour = (
                forage_df_subj["hour"].min(),
                forage_df_subj["hour"].max(),
            )
            complete_hours = pd.DataFrame(
                {"hour": pd.date_range(start=min_hour, end=max_hour, freq="h")}
            )
            forage_df_subj_hour = pd.merge(
                complete_hours, hour_counts, on="hour", how="left"
            ).fillna(0)
            forage_df_subj_hour["n_bouts"] = forage_df_subj_hour["n_bouts"].astype(int)
            # Rename 'cum_wheel_dist' col
            forage_df_subj_hour.rename(
                columns={"cum_wheel_dist": "dist_forage"}, inplace=True
            )
            forage_df_subj_hour["exp"] = exp["name"]
            forage_df_subj_hour["social"] = period == "social"
            forage_df_subj_hour["subject"] = subject
            hour = forage_df_subj_hour["hour"].dt.hour
            forage_df_subj_hour["light"] = ~((hour > light_off) & (hour < light_on))
            forage_hour_df = pd.concat(
                [forage_hour_df, forage_df_subj_hour], ignore_index=True
            )

            forage_dur_subj = forage_df_subj[["start"]].copy()
            forage_dur_subj["duration"] = (
                forage_df_subj["end"] - forage_df_subj["start"]
            ).dt.total_seconds() / 60
            forage_dur_subj["exp"] = exp["name"]
            forage_dur_subj["social"] = period == "social"
            forage_dur_subj["subject"] = subject
            hour = forage_df_subj["start"].dt.hour
            forage_dur_subj["light"] = ~((hour > light_off) & (hour < light_on))
            forage_dur_df = pd.concat(
                [forage_dur_df, forage_dur_subj], ignore_index=True
            )
forage_hour_df.head()
| hour | n_bouts | n_pellets | dist_forage | exp | social | subject | light | |
|---|---|---|---|---|---|---|---|---|
| 0 | 2024-02-09 17:00:00 | 2 | 3.0 | 2166.585576 | social0.2-aeon3 | True | BAA-1104045 | False |
| 1 | 2024-02-09 18:00:00 | 5 | 9.0 | 7640.816624 | social0.2-aeon3 | True | BAA-1104045 | False |
| 2 | 2024-02-09 19:00:00 | 2 | 7.0 | 4032.787109 | social0.2-aeon3 | True | BAA-1104045 | False |
| 3 | 2024-02-09 20:00:00 | 3 | 4.0 | 1939.771139 | social0.2-aeon3 | True | BAA-1104045 | True |
| 4 | 2024-02-09 21:00:00 | 0 | 0.0 | 0.000000 | social0.2-aeon3 | True | BAA-1104045 | True |
forage_dur_df.head()
| start | duration | exp | social | subject | light | |
|---|---|---|---|---|---|---|
| 0 | 2024-02-09 17:52:33.300 | 2.521333 | social0.2-aeon3 | True | BAA-1104045 | False |
| 1 | 2024-02-09 17:59:05.520 | 3.124333 | social0.2-aeon3 | True | BAA-1104045 | False |
| 2 | 2024-02-09 18:07:29.060 | 1.892333 | social0.2-aeon3 | True | BAA-1104045 | False |
| 3 | 2024-02-09 18:17:54.320 | 3.776333 | social0.2-aeon3 | True | BAA-1104045 | False |
| 4 | 2024-02-09 18:38:15.980 | 5.895667 | social0.2-aeon3 | True | BAA-1104045 | False |
# Plot foraging bouts per hour histogram for each combination
fig, ax = plt.subplots(figsize=(10, 6))
for i, (social_val, light_val) in enumerate(combos):
    subset = forage_hour_df[
        (forage_hour_df["social"] == social_val)
        & (forage_hour_df["light"] == light_val)
        & (forage_hour_df["n_pellets"] > 0)
    ]
    # Plot normalized histogram
    hist = sns.histplot(
        data=subset,
        x="n_bouts",
        stat="probability",
        alpha=0.5,
        color=colors[light_val],
        label=labels[i],
        # kde=True,  # Add kernel density estimate
        common_norm=False,  # Ensure each histogram is normalized separately
        axes=ax,
        binwidth=1,
    )
    # Set hatch pattern for bars
    if hatches[social_val]:
        for bar in hist.patches:
            bar.set_hatch(hatches[social_val])

ax.set_title("Normalized Foraging Bout Distributions by Social and Light Conditions")
ax.set_xlabel("Foraging bouts / hour")
ax.set_ylabel("Probability")
ax.legend(title="Conditions")
ax.set_xlim(1, 15)
plt.tight_layout()
plt.show()
# Plot foraging bouts per hour bars
fig, ax = plt.subplots(figsize=(10, 6))
summary_data = []
for social_val in [True, False]:
    for light_val in [True, False]:
        subset = forage_hour_df[
            (forage_hour_df["social"] == social_val)
            & (forage_hour_df["light"] == light_val)
        ]
        mean_n_bouts = subset["n_bouts"].mean()
        sem_n_bouts = subset["n_bouts"].sem()
        n_samples = len(subset)
        summary_data.append(
            {
                "social": social_val,
                "light": light_val,
                "mean_n_bouts": mean_n_bouts,
                "sem": sem_n_bouts,
                "condition": f"{'Social' if social_val else 'Solo'}-{'Light' if light_val else 'Dark'}",
                "n": n_samples,
            }
        )

summary_df = pd.DataFrame(summary_data)
# Set up positions for the bars
bar_width = 0.5
x_pos = np.array([0.25, 2.25, 0.75, 2.75])  # create two groups with a gap in the middle
# Plot bars
for i, row in enumerate(summary_data):
    pos = x_pos[i]
    social_val = row["social"]
    light_val = row["light"]
    bar = ax.bar(
        pos,
        row["mean_n_bouts"],
        bar_width,
        yerr=row["sem"],
        color=colors[light_val],
        edgecolor="black",
        capsize=7,
        label=f"{row['condition']}: μ={row['mean_n_bouts']:.2f}, SEM={row['sem']:.2f}",
    )
    # Apply hatching for social conditions
    if hatches[social_val]:
        bar[0].set_hatch(hatches[social_val])
    # Add sample size as text above each bar
    sample_size_txt = ax.text(
        pos,
        row["mean_n_bouts"] + row["sem"] + 0.1,
        f"n={row['n']}",
        ha="center",
        va="bottom",
    )

ax.set_title("Mean Number of Foraging Bouts per Hour by Social and Light Conditions")
ax.set_ylabel("Number of bouts / hour")
ax.set_xticks(x_pos)
ax.set_xticklabels(["Social\nLight", "Social\nDark", "Solo\nLight", "Solo\nDark"])
ax.legend(title="Conditions", loc="upper left")
# Wilcoxon rank sum tests
light_social = forage_hour_df.query("social and light")["n_bouts"]
light_solo = forage_hour_df.query("not social and light")["n_bouts"]
dark_social = forage_hour_df.query("social and not light")["n_bouts"]
dark_solo = forage_hour_df.query("not social and not light")["n_bouts"]
light_stat, light_p = stats.ttest_ind(
    light_social, light_solo, alternative="two-sided", equal_var=False
)
dark_stat, dark_p = stats.ttest_ind(
    dark_social, dark_solo, alternative="two-sided", equal_var=False
)
test_text = (
    f"Two-sample t-tests:\n"
    f"Light conditions: p = {light_p:.2e}\nDark conditions: p = {dark_p:.2e}"
)
props = dict(boxstyle="round,pad=0.3", facecolor="lightgray", alpha=0.8)
ax.text(
    0.02,
    0.68,
    test_text,
    transform=ax.transAxes,
    verticalalignment="top",
    bbox=props,
)
plt.tight_layout()
plt.show()

# Plot foraging bouts duration histogram for each combination
fig, ax = plt.subplots(figsize=(10, 6))
for i, (social_val, light_val) in enumerate(combos):
subset = forage_dur_df[
(forage_dur_df["social"] == social_val) & (forage_dur_df["light"] == light_val)
]
# Plot normalized histogram
hist = sns.histplot(
data=subset,
x="duration",
stat="probability",
alpha=0.5,
color=colors[light_val],
label=labels[i],
# kde=True, # Add kernel density estimate
common_norm=False, # Ensure each histogram is normalized separately
axes=ax,
binwidth=1,
)
# Set hatch pattern for bars
if hatches[social_val]:
for bar in hist.patches:
bar.set_hatch(hatches[social_val])
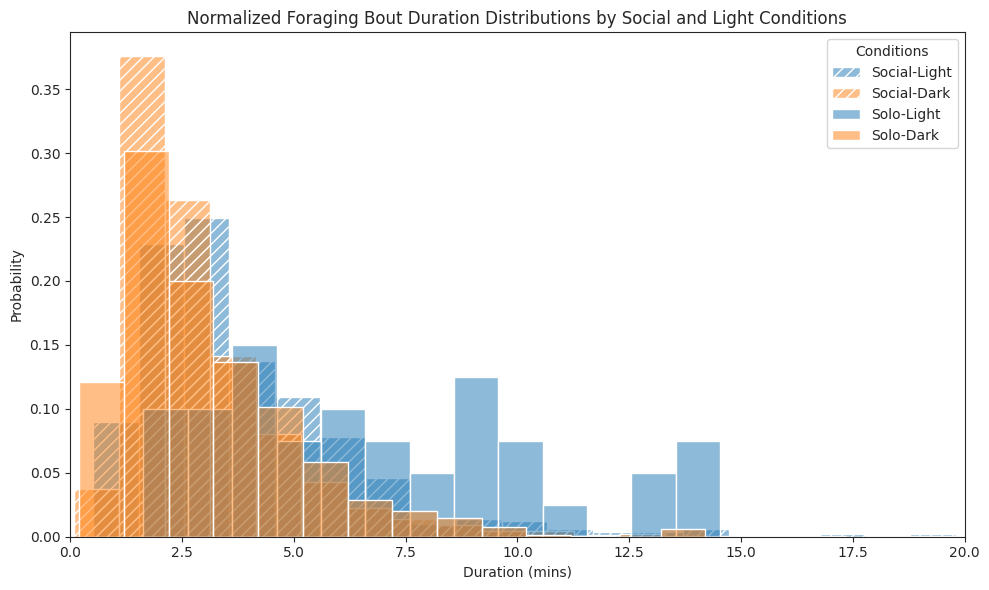
ax.set_title(
"Normalized Foraging Bout Duration Distributions by Social and Light Conditions"
)
ax.set_xlabel("Duration (mins)")
ax.set_ylabel("Probability")
ax.legend(title="Conditions")
ax.set_xlim(0, 20)
plt.tight_layout()
plt.show()
# Plot foraging bouts duration bars
max_forage_thresh = 30  # in minutes
fig, ax = plt.subplots(figsize=(10, 6))
summary_data = []
for social_val in [True, False]:
    for light_val in [True, False]:
        subset = forage_dur_df[
            (forage_dur_df["social"] == social_val)
            & (forage_dur_df["light"] == light_val)
            & (forage_dur_df["duration"] < max_forage_thresh)
        ]
        mean_duration = subset["duration"].mean()
        sem_duration = subset["duration"].sem()
        n_samples = len(subset)
        summary_data.append(
            {
                "social": social_val,
                "light": light_val,
                "mean_duration": mean_duration,
                "sem": sem_duration,
                "condition": f"{'Social' if social_val else 'Solo'}-{'Light' if light_val else 'Dark'}",
                "n": n_samples,
            }
        )

summary_df = pd.DataFrame(summary_data)
# Set up positions for the bars
bar_width = 0.5
x_pos = np.array([0.25, 2.25, 0.75, 2.75])  # create two groups with a gap in the middle
# Plot bars
for i, row in enumerate(summary_data):
    pos = x_pos[i]
    social_val = row["social"]
    light_val = row["light"]
    bar = ax.bar(
        pos,
        row["mean_duration"],
        bar_width,
        yerr=row["sem"],
        color=colors[light_val],
        edgecolor="black",
        capsize=7,
        label=f"{row['condition']}: μ={row['mean_duration']:.2f}, SEM={row['sem']:.2f}",
    )
    # Apply hatching for social conditions
    if hatches[social_val]:
        bar[0].set_hatch(hatches[social_val])
    # Add sample size as text above each bar
    sample_size_txt = ax.text(
        pos,
        row["mean_duration"] + row["sem"] + 0.1,
        f"n={row['n']}",
        ha="center",
        va="bottom",
    )

ax.set_title("Mean Duration of Foraging Bouts by Social and Light Conditions")
ax.set_ylabel("Mean Duration (minutes)")
ax.set_xticks(x_pos)
ax.set_xticklabels(["Social\nLight", "Social\nDark", "Solo\nLight", "Solo\nDark"])
ax.legend(title="Conditions", loc="upper right")
# Wilcoxon rank sum tests
light_social = forage_dur_df.query(
    "social and light and duration < @max_forage_thresh"
)["duration"]
light_solo = forage_dur_df.query(
    "not social and light and duration < @max_forage_thresh"
)["duration"]
dark_social = forage_dur_df.query(
    "social and not light and duration < @max_forage_thresh"
)["duration"]
dark_solo = forage_dur_df.query(
    "not social and not light and duration < @max_forage_thresh"
)["duration"]
light_stat, light_p = stats.ttest_ind(
    light_social, light_solo, alternative="two-sided", equal_var=False
)
dark_stat, dark_p = stats.ttest_ind(
    dark_social, dark_solo, alternative="two-sided", equal_var=False
)
test_text = (
    f"Two-sample t-tests:\n"
    f"Light conditions: p = {light_p:.2e}\nDark conditions: p = {dark_p:.2e}"
)
props = dict(boxstyle="round,pad=0.3", facecolor="lightgray", alpha=0.8)
ax.text(
    0.70,
    0.68,
    test_text,
    transform=ax.transAxes,
    verticalalignment="top",
    bbox=props,
)
plt.tight_layout()
plt.show()
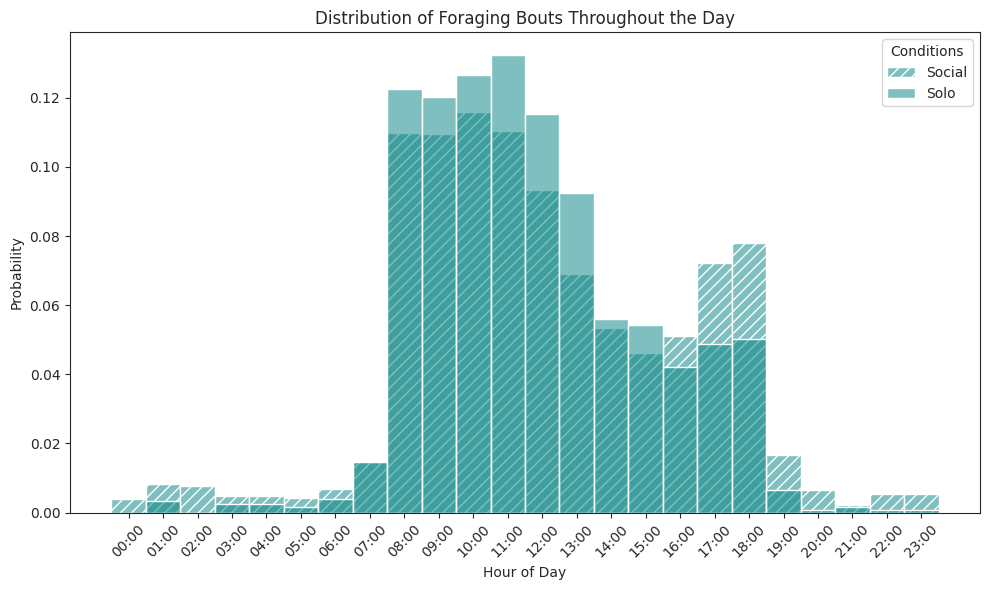
# Plot foraging bouts over all hours histogram
fig, ax = plt.subplots(figsize=(10, 6))
for i, social_val in enumerate([True, False]):
    subset = forage_dur_df[(forage_dur_df["social"] == social_val)]
    # Create the histogram
    hist = sns.histplot(
        data=subset,
        x=subset["start"].dt.hour,
        stat="probability",  # Normalize to show probability
        alpha=0.5,
        color="teal",
        label="Social" if social_val else "Solo",
        common_norm=False,  # Each condition normalized separately
        ax=ax,
        bins=24,  # 24 hours
        discrete=True,  # Since hours are discrete values
    )
    # Apply hatching pattern for social conditions
    if hatches[social_val]:
        # Apply the hatch pattern to each bar
        for patch in hist.patches:
            patch.set_hatch(hatches[social_val])

# Set x-tick labels for every hour
ax.set_xticks(range(0, 24))
ax.set_xticklabels([f"{h:02d}:00" for h in range(0, 24)], rotation=45)
# Customize axis labels and title
ax.set_title("Distribution of Foraging Bouts Throughout the Day")
ax.set_xlabel("Hour of Day")
ax.set_ylabel("Probability")
ax.legend(title="Conditions")
plt.tight_layout()
plt.show()
# Plot pellet rate per hour histograms for each combination
fig, ax = plt.subplots(figsize=(10, 6))
for i, (social_val, light_val) in enumerate(combos):
    subset = forage_hour_df[
        (forage_hour_df["social"] == social_val)
        & (forage_hour_df["light"] == light_val)
        & (forage_hour_df["n_pellets"] > 0)
    ]
    # Plot normalized histogram
    hist = sns.histplot(
        data=subset,
        x="n_pellets",
        stat="probability",
        alpha=0.5,
        color=colors[light_val],
        label=labels[i],
        # kde=True,  # Add kernel density estimate
        common_norm=False,  # Ensure each histogram is normalized separately
        axes=ax,
        binwidth=1,
    )
    # Set hatch pattern for bars
    if hatches[social_val]:
        for bar in hist.patches:
            bar.set_hatch(hatches[social_val])

ax.set_title("Normalized Pellet Rate Distributions by Social and Light Conditions")
ax.set_xlabel("Number of pellets / hour")
ax.set_ylabel("Probability")
ax.legend(title="Conditions")
ax.set_xlim(3, 35)
plt.tight_layout()
plt.show()

# Plot pellet rate per hour bars for each combination
fig, ax = plt.subplots(figsize=(10, 6))
summary_data = []
for social_val in [True, False]:
    for light_val in [True, False]:
        subset = forage_hour_df[
            (forage_hour_df["social"] == social_val)
            & (forage_hour_df["light"] == light_val)
        ]
        mean_n_pellets = subset["n_pellets"].mean()
        sem_n_pellets = subset["n_pellets"].sem()
        n_samples = len(subset)
        summary_data.append(
            {
                "social": social_val,
                "light": light_val,
                "mean_n_pellets": mean_n_pellets,
                "sem": sem_n_pellets,
                "condition": f"{'Social' if social_val else 'Solo'}-{'Light' if light_val else 'Dark'}",
                "n": n_samples,
            }
        )

summary_df = pd.DataFrame(summary_data)
# Set up positions for the bars
bar_width = 0.5
x_pos = np.array([0.25, 2.25, 0.75, 2.75])  # create two groups with a gap in the middle
# Plot bars
for i, row in enumerate(summary_data):
    pos = x_pos[i]
    social_val = row["social"]
    light_val = row["light"]
    bar = ax.bar(
        pos,
        row["mean_n_pellets"],
        bar_width,
        yerr=row["sem"],
        color=colors[light_val],
        edgecolor="black",
        capsize=7,
        label=f"{row['condition']}: μ={row['mean_n_pellets']:.2f}, SEM={row['sem']:.2f}",
    )
    # Apply hatching for social conditions
    if hatches[social_val]:
        bar[0].set_hatch(hatches[social_val])
    # Add sample size as text above each bar
    sample_size_txt = ax.text(
        pos,
        row["mean_n_pellets"] + row["sem"] + 0.1,
        f"n={row['n']}",
        ha="center",
        va="bottom",
    )

ax.set_title("Mean Number of Pellets per hour by Social and Light Conditions")
ax.set_ylabel("Number of pellets / hour")
ax.set_xticks(x_pos)
ax.set_xticklabels(["Social\nLight", "Social\nDark", "Solo\nLight", "Solo\nDark"])
ax.legend(title="Conditions", loc="upper left")
light_social = forage_hour_df.query("social and light")["n_pellets"]
light_solo = forage_hour_df.query("not social and light")["n_pellets"]
dark_social = forage_hour_df.query("social and not light")["n_pellets"]
dark_solo = forage_hour_df.query("not social and not light")["n_pellets"]
light_stat, light_p = stats.ttest_ind(
    light_social, light_solo, alternative="two-sided", equal_var=False
)
dark_stat, dark_p = stats.ttest_ind(
    dark_social, dark_solo, alternative="two-sided", equal_var=False
)
test_text = (
    f"Two-sample t-tests:\n"
    f"Light conditions: p = {light_p:.2e}\nDark conditions: p = {dark_p:.2e}"
)
props = dict(boxstyle="round,pad=0.3", facecolor="lightgray", alpha=0.8)
ax.text(
    0.02,
    0.68,  # Position below the legend (since legend is upper left)
    test_text,
    transform=ax.transAxes,
    verticalalignment="top",
    bbox=props,
)
plt.tight_layout()
plt.show()
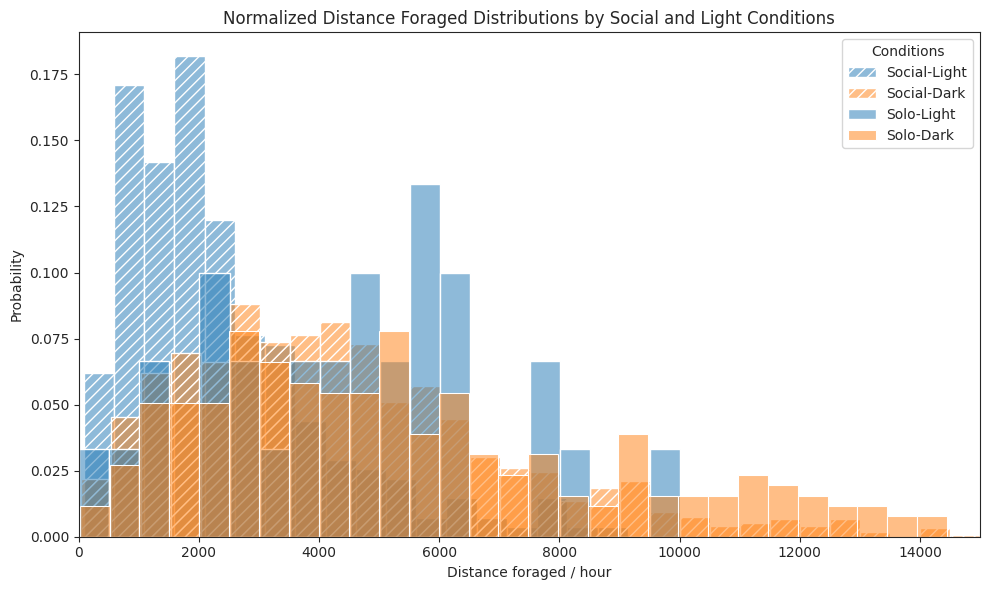
# Plot distance foraged rate per hour histograms for each combination
fig, ax = plt.subplots(figsize=(10, 6))
for i, (social_val, light_val) in enumerate(combos):
    subset = forage_hour_df[
        (forage_hour_df["social"] == social_val)
        & (forage_hour_df["light"] == light_val)
        & (forage_hour_df["n_pellets"] > 0)
    ]
    # Plot normalized histogram
    hist = sns.histplot(
        data=subset,
        x="dist_forage",
        stat="probability",
        alpha=0.5,
        color=colors[light_val],
        label=labels[i],
        # kde=True,  # Add kernel density estimate
        common_norm=False,  # Ensure each histogram is normalized separately
        axes=ax,
        binwidth=500,
    )
    # Set hatch pattern for bars
    if hatches[social_val]:
        for bar in hist.patches:
            bar.set_hatch(hatches[social_val])

ax.set_title("Normalized Distance Foraged Distributions by Social and Light Conditions")
ax.set_xlabel("Distance foraged / hour")
ax.set_ylabel("Probability")
ax.legend(title="Conditions")
ax.set_xlim(0, 15000)
plt.tight_layout()
plt.show()
# Plot distance foraged rate per hour bars
fig, ax = plt.subplots(figsize=(10, 6))
summary_data = []
for social_val in [True, False]:
    for light_val in [True, False]:
        subset = forage_hour_df[
            (forage_hour_df["social"] == social_val)
            & (forage_hour_df["light"] == light_val)
        ]
        mean_dist_forage = subset["dist_forage"].mean()
        sem_dist_forage = subset["dist_forage"].sem()
        n_samples = len(subset)
        summary_data.append(
            {
                "social": social_val,
                "light": light_val,
                "mean_dist_forage": mean_dist_forage,
                "sem": sem_dist_forage,
                "condition": f"{'Social' if social_val else 'Solo'}-{'Light' if light_val else 'Dark'}",
                "n": n_samples,
            }
        )

summary_df = pd.DataFrame(summary_data)
# Set up positions for the bars
bar_width = 0.5
x_pos = np.array([0.25, 2.25, 0.75, 2.75])  # create two groups with a gap in the middle
# Plot bars
for i, row in enumerate(summary_data):
    pos = x_pos[i]
    social_val = row["social"]
    light_val = row["light"]
    bar = ax.bar(
        pos,
        row["mean_dist_forage"],
        bar_width,
        yerr=row["sem"],
        color=colors[light_val],
        edgecolor="black",
        capsize=7,
        label=f"{row['condition']}: μ={row['mean_dist_forage']:.2f}, SEM={row['sem']:.2f}",
    )
    # Apply hatching for social conditions
    if hatches[social_val]:
        bar[0].set_hatch(hatches[social_val])
    # Add sample size as text above each bar
    sample_size_txt = ax.text(
        pos,
        row["mean_dist_forage"] + row["sem"] + 10,
        f"n={row['n']}",
        ha="center",
        va="bottom",
    )

ax.set_title("Mean Distance Foraged per hour by Social and Light Conditions")
ax.set_ylabel("Distance foraged / hour (cm)")
ax.set_xticks(x_pos)
ax.set_xticklabels(["Social\nLight", "Social\nDark", "Solo\nLight", "Solo\nDark"])
ax.legend(title="Conditions", loc="upper left")
# Wilcoxon rank sum tests
light_social = forage_hour_df.query("social and light")["dist_forage"]
light_solo = forage_hour_df.query("not social and light")["dist_forage"]
dark_social = forage_hour_df.query("social and not light")["dist_forage"]
dark_solo = forage_hour_df.query("not social and not light")["dist_forage"]
light_stat, light_p = stats.ttest_ind(
    light_social, light_solo, alternative="two-sided", equal_var=False
)
dark_stat, dark_p = stats.ttest_ind(
    dark_social, dark_solo, alternative="two-sided", equal_var=False
)

test_text = (
    f"Two-sample t-tests:\n"
    f"Light conditions: p = {light_p:.2e}\nDark conditions: p = {dark_p:.2e}"
)
props = dict(boxstyle="round,pad=0.3", facecolor="lightgray", alpha=0.8)
ax.text(
    0.02,
    0.68,  # Position below the legend (since legend is upper left)
    test_text,
    transform=ax.transAxes,
    verticalalignment="top",
    bbox=props,
)
plt.tight_layout()
plt.show()
Sleeping#
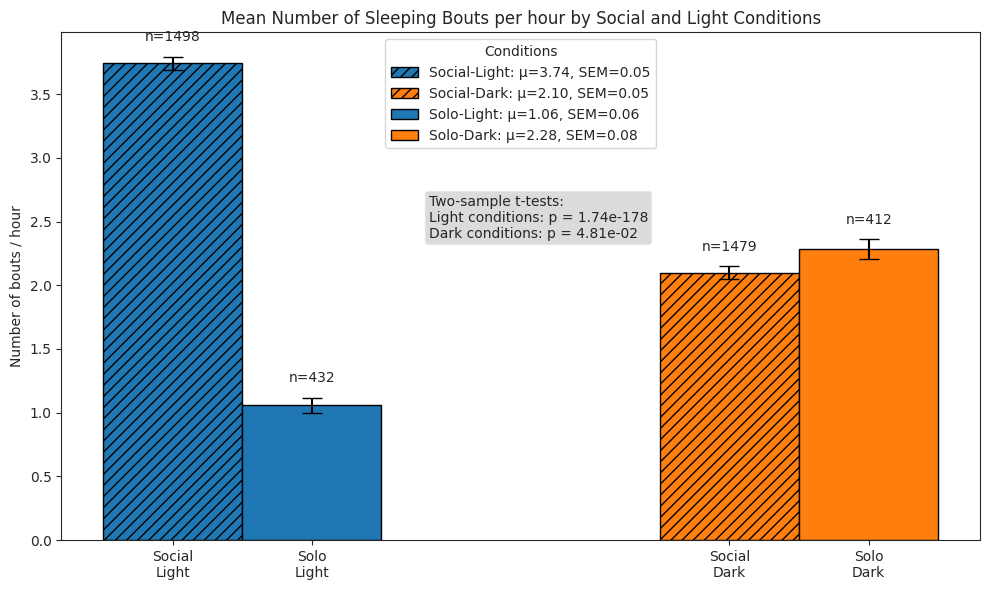
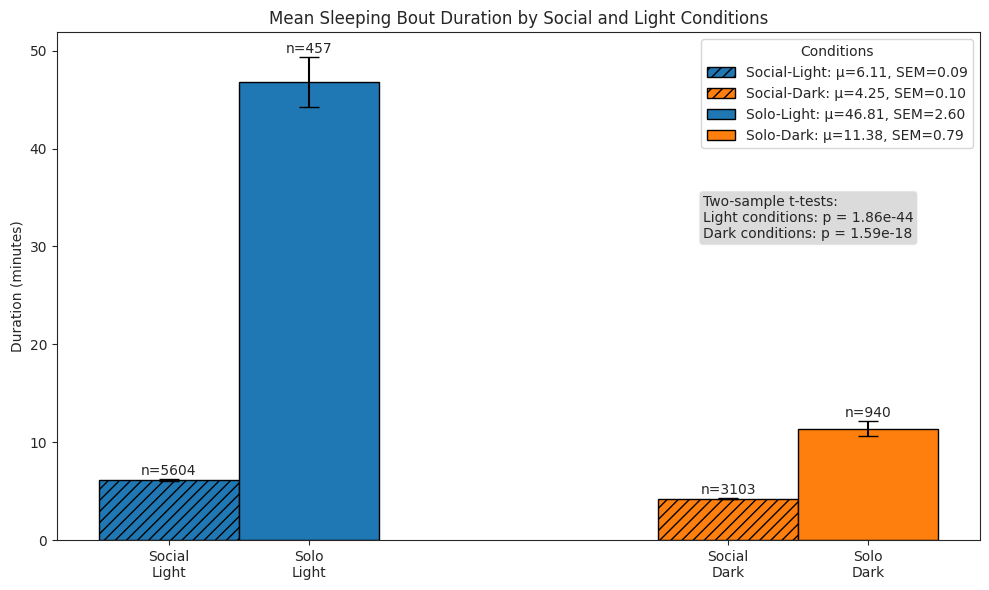
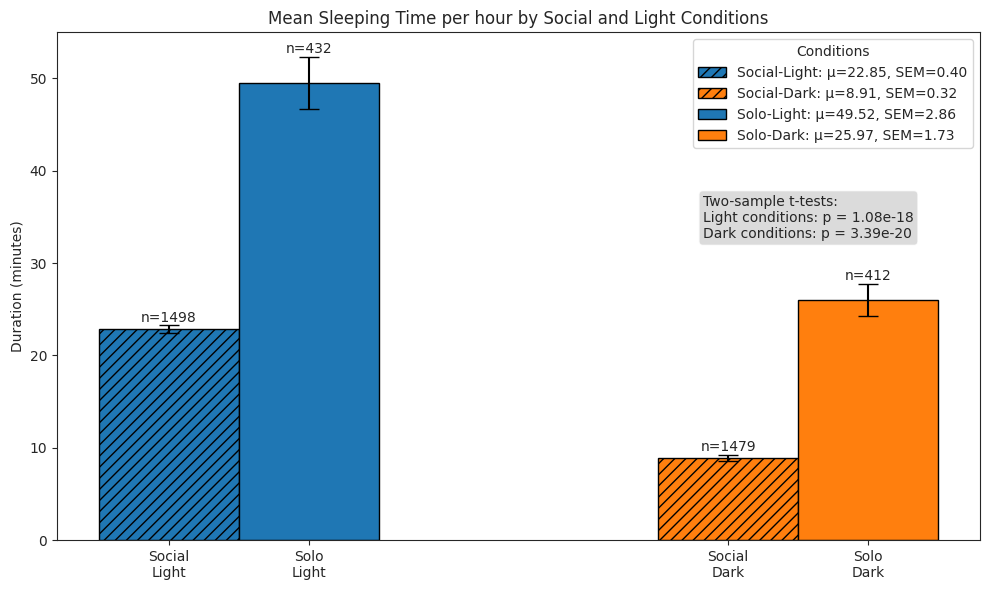
We compare subjects’ sleeping behaviour in solo and social conditions across light and dark cycles by quantifying the following:
number of sleeping bouts per hour
duration of bouts
total time spent sleeping per hour
sleep_dur_df = pd.DataFrame(
    {
        "subject": pd.Series(dtype="string"),
        "start": pd.Series(dtype="datetime64[ns]"),
        "end": pd.Series(dtype="datetime64[ns]"),
        "duration": pd.Series(dtype="float"),  # in minutes
        "period": pd.Series(dtype="string"),
        "light": pd.Series(dtype="bool"),
    }
)
sleep_hour_df = pd.DataFrame(
    {
        "subject": pd.Series(dtype="string"),
        "hour": pd.Series(dtype="datetime64[ns]"),
        "n_bouts": pd.Series(dtype="int"),
        "duration": pd.Series(dtype="float"),  # in minutes
        "period": pd.Series(dtype="string"),
        "light": pd.Series(dtype="bool"),
    }
)
exp_pbar = tqdm(experiments, desc="Experiments", position=0, leave=True)
for exp in exp_pbar:
    period_pbar = tqdm(periods, desc="Periods", position=1, leave=False)
    for period in period_pbar:
        sleep_bouts_df = load_data_from_parquet(
            experiment_name=exp["name"],
            period=period,
            data_type="sleep",
            data_dir=data_dir,
            set_time_index=True,
        )
        # Get sleep bout durations
        hour = sleep_bouts_df["start"].dt.hour
        sleep_bouts_df["light"] = ~((hour > light_off) & (hour < light_on))
        sleep_dur_df = pd.concat([sleep_dur_df, sleep_bouts_df], ignore_index=True)
        # Get n sleep bouts and total duration per hour
        for subject in sleep_bouts_df["subject"].unique():
            sleep_df_subj = sleep_bouts_df[sleep_bouts_df["subject"] == subject]
            sleep_df_subj["hour"] = sleep_df_subj["start"].dt.floor("h")
            hour_stats = (
                sleep_df_subj.groupby("hour")
                .agg({"duration": ["count", "sum"]})
                .reset_index()
            )
            hour_stats.columns = ["hour", "n_bouts", "duration"]
            min_hour, max_hour = (
                sleep_df_subj["hour"].min(),
                sleep_df_subj["hour"].max(),
            )
            complete_hours = pd.DataFrame(
                {"hour": pd.date_range(start=min_hour, end=max_hour, freq="h")}
            )
            sleep_df_subj_hour = pd.merge(
                complete_hours, hour_stats, on="hour", how="left"
            ).fillna(0)
            sleep_df_subj_hour["n_bouts"] = sleep_df_subj_hour["n_bouts"].astype(int)
            sleep_df_subj_hour["period"] = period
            sleep_df_subj_hour["subject"] = subject
            hour = sleep_df_subj_hour["hour"].dt.hour
            sleep_df_subj_hour["light"] = ~((hour > light_off) & (hour < light_on))
            sleep_hour_df = pd.concat(
                [sleep_hour_df, sleep_df_subj_hour], ignore_index=True
            )

sleep_dur_df["duration"] = (
    pd.to_timedelta(sleep_dur_df["duration"]).dt.total_seconds() / 60
)
sleep_hour_df["duration"] = (
    pd.to_timedelta(sleep_hour_df["duration"]).dt.total_seconds() / 60
)
sleep_hour_df.head()
| subject | hour | n_bouts | duration | period | light | |
|---|---|---|---|---|---|---|
| 0 | BAA-1104045 | 2024-02-09 18:00:00 | 1 | 2.0 | social | False |
| 1 | BAA-1104045 | 2024-02-09 19:00:00 | 3 | 16.0 | social | False |
| 2 | BAA-1104045 | 2024-02-09 20:00:00 | 4 | 18.0 | social | True |
| 3 | BAA-1104045 | 2024-02-09 21:00:00 | 3 | 41.0 | social | True |
| 4 | BAA-1104045 | 2024-02-09 22:00:00 | 3 | 63.0 | social | True |
sleep_dur_df.head()
| subject | start | end | duration | period | light | |
|---|---|---|---|---|---|---|
| 0 | BAA-1104045 | 2024-02-09 18:24:42.540 | 2024-02-09 18:26:42.540 | 2.0 | social | False |
| 1 | BAA-1104045 | 2024-02-09 19:18:42.540 | 2024-02-09 19:23:42.540 | 5.0 | social | False |
| 2 | BAA-1104045 | 2024-02-09 19:50:42.540 | 2024-02-09 19:53:42.540 | 3.0 | social | False |
| 3 | BAA-1104045 | 2024-02-09 19:59:42.540 | 2024-02-09 20:07:42.540 | 8.0 | social | False |
| 4 | BAA-1104045 | 2024-02-09 20:12:42.540 | 2024-02-09 20:15:42.540 | 3.0 | social | True |
# Plot bars of bouts per hour
fig, ax = plt.subplots(figsize=(10, 6))
summary_data = []
for social_val in ["social", "postsocial"]:
    for light_val in [True, False]:
        subset = sleep_hour_df[
            (sleep_hour_df["period"] == social_val)
            & (sleep_hour_df["light"] == light_val)
        ]
        mean_n_bouts = subset["n_bouts"].mean()
        sem_n_bouts = subset["n_bouts"].sem()
        n_samples = len(subset)
        summary_data.append(
            {
                "social": social_val,
                "light": light_val,
                "mean_n_bouts": mean_n_bouts,
                "sem": sem_n_bouts,
                "condition": (
                    f"{'Social' if social_val == 'social' else 'Solo'}-"
                    f"{'Light' if light_val else 'Dark'}"
                ),
                "n": n_samples,
            }
        )

summary_df = pd.DataFrame(summary_data)
# Set up positions for the bars
bar_width = 0.5
x_pos = np.array([0.25, 2.25, 0.75, 2.75])  # create two groups with a gap in the middle
# Plot bars
for i, row in enumerate(summary_data):
    pos = x_pos[i]
    social_val = row["social"]
    light_val = row["light"]
    bar = ax.bar(
        pos,
        row["mean_n_bouts"],
        bar_width,
        yerr=row["sem"],
        color=colors[light_val],
        edgecolor="black",
        capsize=7,
        label=f"{row['condition']}: μ={row['mean_n_bouts']:.2f}, SEM={row['sem']:.2f}",
    )
    # Apply hatching for social conditions
    if hatches[social_val == "social"]:
        bar[0].set_hatch(hatches[social_val == "social"])
    # Add sample size as text above each bar
    sample_size_txt = ax.text(
        pos,
        row["mean_n_bouts"] + row["sem"] + 0.1,
        f"n={row['n']}",
        ha="center",
        va="bottom",
    )

ax.set_title("Mean Number of Sleeping Bouts per hour by Social and Light Conditions")
ax.set_ylabel("Number of bouts / hour")
ax.set_xticks(x_pos)
ax.set_xticklabels(["Social\nLight", "Social\nDark", "Solo\nLight", "Solo\nDark"])
ax.legend(title="Conditions", loc="upper center")
# Perform stats tests
light_social = sleep_hour_df.query("period == 'social' and light")["n_bouts"]
light_solo = sleep_hour_df.query("period == 'postsocial' and light")["n_bouts"]
dark_social = sleep_hour_df.query("period == 'social' and not light")["n_bouts"]
dark_solo = sleep_hour_df.query("period == 'postsocial' and not light")["n_bouts"]
light_stat, light_p = stats.ttest_ind(
    light_social, light_solo, alternative="two-sided", equal_var=False
)
dark_stat, dark_p = stats.ttest_ind(
    dark_social, dark_solo, alternative="two-sided", equal_var=False
)
test_text = (
    f"Two-sample t-tests:\n"
    f"Light conditions: p = {light_p:.2e}"
    f"\nDark conditions: p = {dark_p:.2e}"
)
props = dict(boxstyle="round,pad=0.3", facecolor="lightgray", alpha=0.8)
ax.text(
    0.40,
    0.68,  # Position below the legend
    test_text,
    transform=ax.transAxes,
    verticalalignment="top",
    bbox=props,
)
plt.tight_layout()
plt.show()
sleep_dur_df.groupby(["period", "light"])["duration"].describe()
| count | mean | std | min | 25% | 50% | 75% | max | ||
|---|---|---|---|---|---|---|---|---|---|
| period | light | ||||||||
| postsocial | False | 940.0 | 11.382979 | 24.224019 | 2.0 | 2.0 | 3.0 | 6.0 | 265.0 |
| True | 457.0 | 46.809628 | 55.611719 | 2.0 | 5.0 | 19.0 | 84.0 | 470.0 | |
| social | False | 3103.0 | 4.245891 | 5.517260 | 2.0 | 2.0 | 3.0 | 4.0 | 117.0 |
| True | 5604.0 | 6.108851 | 6.398141 | 2.0 | 2.0 | 4.0 | 7.0 | 82.0 |
# Plot bars of bout durations
fig, ax = plt.subplots(figsize=(10, 6))
summary_data = []
for social_val in ["social", "postsocial"]:
    for light_val in [True, False]:
        subset = sleep_dur_df[
            (sleep_dur_df["period"] == social_val)
            & (sleep_dur_df["light"] == light_val)
        ]
        mean_duration = subset["duration"].mean()
        sem_duration = subset["duration"].sem()
        n_samples = len(subset)
        summary_data.append(
            {
                "social": social_val,
                "light": light_val,
                "mean_duration": mean_duration,
                "sem": sem_duration,
                "condition": (
                    f"{'Social' if social_val == 'social' else 'Solo'}-"
                    f"{'Light' if light_val else 'Dark'}"
                ),
                "n": n_samples,
            }
        )

summary_df = pd.DataFrame(summary_data)
# Set up positions for the bars
bar_width = 0.5
x_pos = np.array([0.25, 2.25, 0.75, 2.75])  # create two groups with a gap in the middle
# Plot bars
for i, row in enumerate(summary_data):
    pos = x_pos[i]
    social_val = row["social"]
    light_val = row["light"]
    bar = ax.bar(
        pos,
        row["mean_duration"],
        bar_width,
        yerr=row["sem"],
        color=colors[light_val],
        edgecolor="black",
        capsize=7,
        label=f"{row['condition']}: μ={row['mean_duration']:.2f}, SEM={row['sem']:.2f}",
    )
    # Apply hatching for social conditions
    if hatches[social_val == "social"]:
        bar[0].set_hatch(hatches[social_val == "social"])
    # Add sample size as text above each bar
    sample_size_txt = ax.text(
        pos,
        row["mean_duration"] + row["sem"] + 0.1,
        f"n={row['n']}",
        ha="center",
        va="bottom",
    )

ax.set_title("Mean Sleeping Bout Duration by Social and Light Conditions")
ax.set_ylabel("Duration (minutes)")
ax.set_xticks(x_pos)
ax.set_xticklabels(["Social\nLight", "Social\nDark", "Solo\nLight", "Solo\nDark"])
ax.legend(title="Conditions")
# Perform stats tests
light_social = sleep_dur_df.query("period == 'social' and light")["duration"]
light_solo = sleep_dur_df.query("period == 'postsocial' and light")["duration"]
dark_social = sleep_dur_df.query("period == 'social' and not light")["duration"]
dark_solo = sleep_dur_df.query("period == 'postsocial' and not light")["duration"]
light_stat, light_p = stats.ttest_ind(
    light_social, light_solo, alternative="two-sided", equal_var=False
)
dark_stat, dark_p = stats.ttest_ind(
    dark_social, dark_solo, alternative="two-sided", equal_var=False
)
test_text = (
    f"Two-sample t-tests:\n"
    f"Light conditions: p = {light_p:.2e}"
    f"\nDark conditions: p = {dark_p:.2e}"
)
props = dict(boxstyle="round,pad=0.3", facecolor="lightgray", alpha=0.8)
ax.text(
    0.70,
    0.68,  # Position below the legend
    test_text,
    transform=ax.transAxes,
    verticalalignment="top",
    bbox=props,
)
plt.tight_layout()
plt.show()
# Plot total time spent sleeping per hour
fig, ax = plt.subplots(figsize=(10, 6))
summary_data = []
for social_val in ["social", "postsocial"]:
    for light_val in [True, False]:
        subset = sleep_hour_df[
            (sleep_hour_df["period"] == social_val)
            & (sleep_hour_df["light"] == light_val)
        ]
        mean_duration = subset["duration"].mean()
        sem_duration = subset["duration"].sem()
        n_samples = len(subset)
        summary_data.append(
            {
                "social": social_val,
                "light": light_val,
                "mean_duration": mean_duration,
                "sem": sem_duration,
                "condition": (
                    f"{'Social' if social_val == 'social' else 'Solo'}-"
                    f"{'Light' if light_val else 'Dark'}"
                ),
                "n": n_samples,
            }
        )

summary_df = pd.DataFrame(summary_data)
# Set up positions for the bars
bar_width = 0.5
x_pos = np.array([0.25, 2.25, 0.75, 2.75])  # create two groups with a gap in the middle
# Plot bars
for i, row in enumerate(summary_data):
    pos = x_pos[i]
    social_val = row["social"]
    light_val = row["light"]
    bar = ax.bar(
        pos,
        row["mean_duration"],
        bar_width,
        yerr=row["sem"],
        color=colors[light_val],
        edgecolor="black",
        capsize=7,
        label=f"{row['condition']}: μ={row['mean_duration']:.2f}, SEM={row['sem']:.2f}",
    )
    # Apply hatching for social conditions
    if hatches[social_val == "social"]:
        bar[0].set_hatch(hatches[social_val == "social"])
    # Add sample size as text above each bar
    sample_size_txt = ax.text(
        pos,
        row["mean_duration"] + row["sem"] + 0.1,
        f"n={row['n']}",
        ha="center",
        va="bottom",
    )

ax.set_title("Mean Sleeping Time per hour by Social and Light Conditions")
ax.set_ylabel("Duration (minutes)")
ax.set_xticks(x_pos)
ax.set_xticklabels(["Social\nLight", "Social\nDark", "Solo\nLight", "Solo\nDark"])
ax.legend(title="Conditions")
# Perform stats tests
light_social = sleep_hour_df.query("period == 'social' and light")["duration"]
light_solo = sleep_hour_df.query("period == 'postsocial' and light")["duration"]
dark_social = sleep_hour_df.query("period == 'social' and not light")["duration"]
dark_solo = sleep_hour_df.query("period == 'postsocial' and not light")["duration"]
light_stat, light_p = stats.ttest_ind(
    light_social, light_solo, alternative="two-sided", equal_var=False
)
dark_stat, dark_p = stats.ttest_ind(
    dark_social, dark_solo, alternative="two-sided", equal_var=False
)
test_text = (
    f"Two-sample t-tests:\n"
    f"Light conditions: p = {light_p:.2e}"
    f"\nDark conditions: p = {dark_p:.2e}"
)
props = dict(boxstyle="round,pad=0.3", facecolor="lightgray", alpha=0.8)
ax.text(
    0.70,
    0.68,  # Position below the legend
    test_text,
    transform=ax.transAxes,
    verticalalignment="top",
    bbox=props,
)
plt.tight_layout()
plt.show()
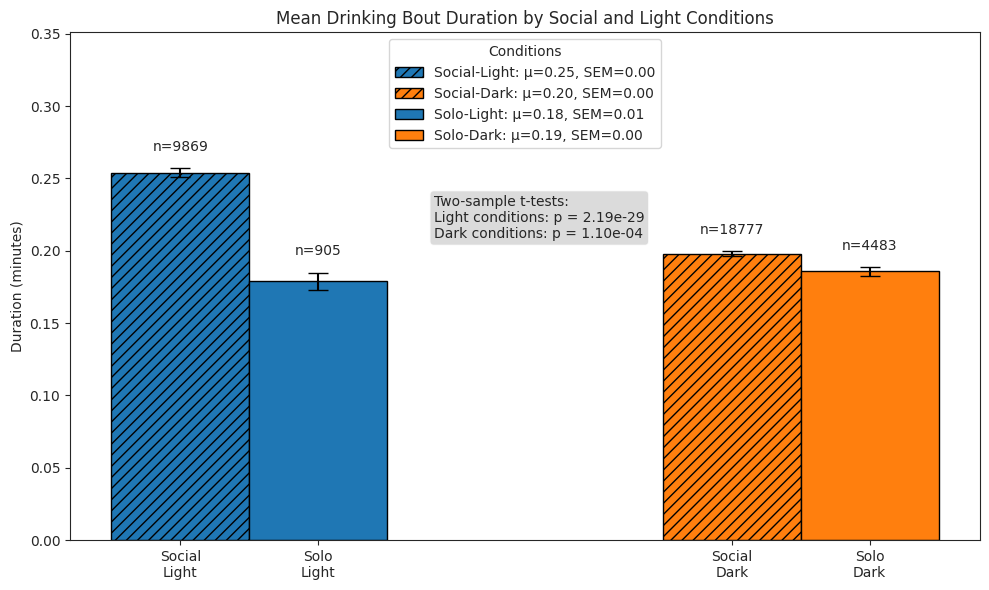
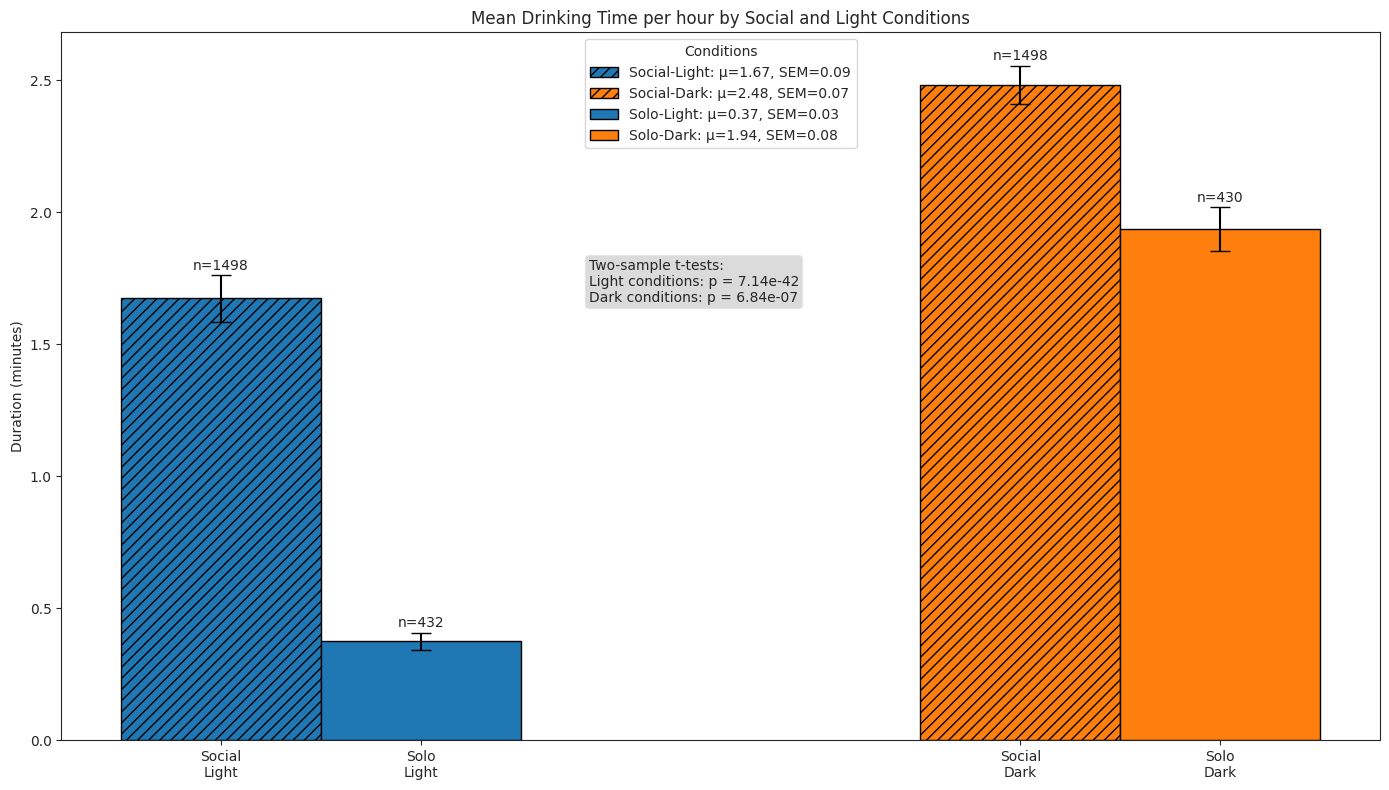
Drinking#
We compare subjects’ drinking behaviour in solo and social conditions across light and dark cycles by quantifying the following:
number of drinking bouts per hour
duration of bouts
total time spent drinking per hour
drink_dur_df = pd.DataFrame(
    {
        "subject": pd.Series(dtype="string"),
        "start": pd.Series(dtype="datetime64[ns]"),
        "end": pd.Series(dtype="datetime64[ns]"),
        "duration": pd.Series(dtype="float"),  # in minutes
        "period": pd.Series(dtype="string"),
        "light": pd.Series(dtype="bool"),
    }
)
drink_hour_df = pd.DataFrame(
    {
        "subject": pd.Series(dtype="string"),
        "hour": pd.Series(dtype="datetime64[ns]"),
        "n_bouts": pd.Series(dtype="int"),
        "duration": pd.Series(dtype="float"),  # in minutes
        "period": pd.Series(dtype="string"),
        "light": pd.Series(dtype="bool"),
    }
)
exp_pbar = tqdm(experiments, desc="Experiments", position=0, leave=True)
for exp in exp_pbar:
    if exp["name"] == "social0.3-aeon4":
        continue  # Skip this experiment as the data is not available
    period_pbar = tqdm(periods, desc="Periods", position=1, leave=False)
    for period in period_pbar:
        sleep_bouts_df = load_data_from_parquet(
            experiment_name=exp["name"],
            period=period,
            data_type="drink",
            data_dir=data_dir,
            set_time_index=True,
        )
        # Get drink bout durations
        hour = sleep_bouts_df["start"].dt.hour
        sleep_bouts_df["light"] = ~((hour > light_off) & (hour < light_on))
        drink_dur_df = pd.concat([drink_dur_df, sleep_bouts_df], ignore_index=True)
        # Get n drink bouts and total duration per hour
        for subject in sleep_bouts_df["subject"].unique():
            sleep_df_subj = sleep_bouts_df[sleep_bouts_df["subject"] == subject]
            sleep_df_subj["hour"] = sleep_df_subj["start"].dt.floor("h")
            hour_stats = (
                sleep_df_subj.groupby("hour")
                .agg({"duration": ["count", "sum"]})
                .reset_index()
            )
            hour_stats.columns = ["hour", "n_bouts", "duration"]
            min_hour, max_hour = (
                sleep_df_subj["hour"].min(),
                sleep_df_subj["hour"].max(),
            )
            complete_hours = pd.DataFrame(
                {"hour": pd.date_range(start=min_hour, end=max_hour, freq="h")}
            )
            sleep_df_subj_hour = pd.merge(
                complete_hours, hour_stats, on="hour", how="left"
            ).fillna(0)
            sleep_df_subj_hour["n_bouts"] = sleep_df_subj_hour["n_bouts"].astype(int)
            sleep_df_subj_hour["period"] = period
            sleep_df_subj_hour["subject"] = subject
            hour = sleep_df_subj_hour["hour"].dt.hour
            sleep_df_subj_hour["light"] = ~((hour > light_off) & (hour < light_on))
            drink_hour_df = pd.concat(
                [drink_hour_df, sleep_df_subj_hour], ignore_index=True
            )

drink_dur_df["duration"] = (
    pd.to_timedelta(drink_dur_df["duration"]).dt.total_seconds() / 60
)
drink_hour_df["duration"] = (
    pd.to_timedelta(drink_hour_df["duration"]).dt.total_seconds() / 60
)
drink_hour_df.head()
| subject | hour | n_bouts | duration | period | light | |
|---|---|---|---|---|---|---|
| 0 | BAA-1104045 | 2024-02-09 16:00:00 | 6 | 0.376667 | social | False |
| 1 | BAA-1104045 | 2024-02-09 17:00:00 | 16 | 5.088333 | social | False |
| 2 | BAA-1104045 | 2024-02-09 18:00:00 | 18 | 3.176667 | social | False |
| 3 | BAA-1104045 | 2024-02-09 19:00:00 | 23 | 4.486667 | social | False |
| 4 | BAA-1104045 | 2024-02-09 20:00:00 | 11 | 1.083333 | social | True |
drink_dur_df.head()
| subject | start | end | duration | period | light | |
|---|---|---|---|---|---|---|
| 0 | BAA-1104045 | 2024-02-09 16:34:06.000 | 2024-02-09 16:34:11.200 | 0.086667 | social | False |
| 1 | BAA-1104045 | 2024-02-09 16:34:15.100 | 2024-02-09 16:34:18.600 | 0.058333 | social | False |
| 2 | BAA-1104045 | 2024-02-09 16:38:13.100 | 2024-02-09 16:38:16.600 | 0.058333 | social | False |
| 3 | BAA-1104045 | 2024-02-09 16:38:34.900 | 2024-02-09 16:38:38.500 | 0.060000 | social | False |
| 4 | BAA-1104045 | 2024-02-09 16:42:16.400 | 2024-02-09 16:42:19.500 | 0.051667 | social | False |
# Plot bars for number of drinking bouts per hour
fig, ax = plt.subplots(figsize=(10, 6))
summary_data = []
for social_val in ["social", "postsocial"]:
    for light_val in [True, False]:
        subset = drink_hour_df[
            (drink_hour_df["period"] == social_val)
            & (drink_hour_df["light"] == light_val)
        ]
        mean_n_bouts = subset["n_bouts"].mean()
        sem_n_bouts = subset["n_bouts"].sem()
        n_samples = len(subset)
        summary_data.append(
            {
                "social": social_val,
                "light": light_val,
                "mean_n_bouts": mean_n_bouts,
                "sem": sem_n_bouts,
                "condition": (
                    f"{'Social' if social_val == 'social' else 'Solo'}-"
                    f"{'Light' if light_val else 'Dark'}"
                ),
                "n": n_samples,
            }
        )

summary_df = pd.DataFrame(summary_data)
# Set up positions for the bars
bar_width = 0.5
x_pos = np.array([0.25, 2.25, 0.75, 2.75])  # create two groups with a gap in the middle
# Plot bars
for i, row in enumerate(summary_data):
    pos = x_pos[i]
    social_val = row["social"]
    light_val = row["light"]
    bar = ax.bar(
        pos,
        row["mean_n_bouts"],
        bar_width,
        yerr=row["sem"],
        color=colors[light_val],
        edgecolor="black",
        capsize=7,
        label=f"{row['condition']}: μ={row['mean_n_bouts']:.2f}, SEM={row['sem']:.2f}",
    )
    # Apply hatching for social conditions
    if hatches[social_val == "social"]:
        bar[0].set_hatch(hatches[social_val == "social"])
    # Add sample size as text above each bar
    sample_size_txt = ax.text(
        pos,
        row["mean_n_bouts"] + row["sem"] + 0.1,
        f"n={row['n']}",
        ha="center",
        va="bottom",
    )

ax.set_title("Mean Number of Drinking Bouts per hour by Social and Light Conditions")
ax.set_ylabel("Number of bouts / hour")
ax.set_xticks(x_pos)
ax.set_xticklabels(["Social\nLight", "Social\nDark", "Solo\nLight", "Solo\nDark"])
# ax.set_ylim([0, 2.01])
ax.legend(title="Conditions")
# Perform stats tests
light_social = drink_hour_df.query("period == 'social' and light")["n_bouts"]
light_solo = drink_hour_df.query("period == 'postsocial' and light")["n_bouts"]
dark_social = drink_hour_df.query("period == 'social' and not light")["n_bouts"]
dark_solo = drink_hour_df.query("period == 'postsocial' and not light")["n_bouts"]
light_stat, light_p = stats.ttest_ind(
    light_social, light_solo, alternative="two-sided", equal_var=False
)
dark_stat, dark_p = stats.ttest_ind(
    dark_social, dark_solo, alternative="two-sided", equal_var=False
)
test_text = (
    f"Two-sample t-tests:\n"
    f"Light conditions: p = {light_p:.2e}"
    f"\nDark conditions: p = {dark_p:.2e}"
)
props = dict(boxstyle="round,pad=0.3", facecolor="lightgray", alpha=0.8)
ax.text(
    0.01,
    0.7,  # Position below the legend
    test_text,
    transform=ax.transAxes,
    verticalalignment="top",
    bbox=props,
)
plt.tight_layout()
plt.show()

# Plot bars of durations of bouts
fig, ax = plt.subplots(figsize=(10, 6))
summary_data = []
for social_val in ["social", "postsocial"]:
    for light_val in [True, False]:
        subset = drink_dur_df[
            (drink_dur_df["period"] == social_val)
            & (drink_dur_df["light"] == light_val)
        ]
        mean_duration = subset["duration"].mean()
        sem_duration = subset["duration"].sem()
        n_samples = len(subset)
        summary_data.append(
            {
                "social": social_val,
                "light": light_val,
                "mean_duration": mean_duration,
                "sem": sem_duration,
                "condition": (
                    f"{'Social' if social_val == 'social' else 'Solo'}-"
                    f"{'Light' if light_val else 'Dark'}"
                ),
                "n": n_samples,
            }
        )

summary_df = pd.DataFrame(summary_data)
# Set up positions for the bars
bar_width = 0.5
x_pos = np.array([0.25, 2.25, 0.75, 2.75])  # create two groups with a gap in the middle
# Plot bars
for i, row in enumerate(summary_data):
    pos = x_pos[i]
    social_val = row["social"]
    light_val = row["light"]
    bar = ax.bar(
        pos,
        row["mean_duration"],
        bar_width,
        yerr=row["sem"],
        color=colors[light_val],
        edgecolor="black",
        capsize=7,
        label=f"{row['condition']}: μ={row['mean_duration']:.2f}, SEM={row['sem']:.2f}",
    )
    # Apply hatching for social conditions
    if hatches[social_val == "social"]:
        bar[0].set_hatch(hatches[social_val == "social"])
    # Add sample size as text above each bar
    sample_size_txt = ax.text(
        pos,
        row["mean_duration"] + row["sem"] + 0.01,
        f"n={row['n']}",
        ha="center",
        va="bottom",
    )

ax.set_title("Mean Drinking Bout Duration by Social and Light Conditions")
ax.set_ylabel("Duration (minutes)")
ax.set_xticks(x_pos)
ax.set_ylim([0, 0.351])
ax.set_xticklabels(["Social\nLight", "Social\nDark", "Solo\nLight", "Solo\nDark"])
ax.legend(title="Conditions", loc="upper center")
# Perform stats tests
light_social = drink_dur_df.query("period == 'social' and light")["duration"]
light_solo = drink_dur_df.query("period == 'postsocial' and light")["duration"]
dark_social = drink_dur_df.query("period == 'social' and not light")["duration"]
dark_solo = drink_dur_df.query("period == 'postsocial' and not light")["duration"]
light_stat, light_p = stats.ttest_ind(
    light_social, light_solo, alternative="two-sided", equal_var=False
)
dark_stat, dark_p = stats.ttest_ind(
    dark_social, dark_solo, alternative="two-sided", equal_var=False
)
test_text = (
    f"Two-sample t-tests:\n"
    f"Light conditions: p = {light_p:.2e}"
    f"\nDark conditions: p = {dark_p:.2e}"
)
props = dict(boxstyle="round,pad=0.3", facecolor="lightgray", alpha=0.8)
ax.text(
    0.40,
    0.68,  # Position below the legend
    test_text,
    transform=ax.transAxes,
    verticalalignment="top",
    bbox=props,
)
plt.tight_layout()
plt.show()
# PLot total time spent drinking per hour
fig, ax = plt.subplots(figsize=(14, 8))
summary_data = []
for social_val in ["social", "postsocial"]:
    for light_val in [True, False]:
        subset = drink_hour_df[
            (drink_hour_df["period"] == social_val)
            & (drink_hour_df["light"] == light_val)
        ]
        mean_duration = subset["duration"].mean()
        sem_duration = subset["duration"].sem()
        n_samples = len(subset)
        summary_data.append(
            {
                "social": social_val,
                "light": light_val,
                "mean_duration": mean_duration,
                "sem": sem_duration,
                "condition": (
                    f"{'Social' if social_val == 'social' else 'Solo'}-"
                    f"{'Light' if light_val else 'Dark'}"
                ),
                "n": n_samples,
            }
        )

summary_df = pd.DataFrame(summary_data)
# Set up positions for the bars
bar_width = 0.5
x_pos = np.array([0.25, 2.25, 0.75, 2.75])  # create two groups with a gap in the middle
# Plot bars
for i, row in enumerate(summary_data):
    pos = x_pos[i]
    social_val = row["social"]
    light_val = row["light"]
    bar = ax.bar(
        pos,
        row["mean_duration"],
        bar_width,
        yerr=row["sem"],
        color=colors[light_val],
        edgecolor="black",
        capsize=7,
        label=f"{row['condition']}: μ={row['mean_duration']:.2f}, SEM={row['sem']:.2f}",
    )
    # Apply hatching for social conditions
    if hatches[social_val == "social"]:
        bar[0].set_hatch(hatches[social_val == "social"])
    # Add sample size as text above each bar
    sample_size_txt = ax.text(
        pos,
        row["mean_duration"] + row["sem"] + 0.01,
        f"n={row['n']}",
        ha="center",
        va="bottom",
    )

ax.set_title("Mean Drinking Time per hour by Social and Light Conditions")
ax.set_ylabel("Duration (minutes)")
ax.set_xticks(x_pos)
ax.set_xticklabels(["Social\nLight", "Social\nDark", "Solo\nLight", "Solo\nDark"])
ax.legend(title="Conditions", loc="upper center")
# Perform stats tests
light_social = drink_hour_df.query("period == 'social' and light")["duration"]
light_solo = drink_hour_df.query("period == 'postsocial' and light")["duration"]
dark_social = drink_hour_df.query("period == 'social' and not light")["duration"]
dark_solo = drink_hour_df.query("period == 'postsocial' and not light")["duration"]
light_stat, light_p = stats.ttest_ind(
    light_social, light_solo, alternative="two-sided", equal_var=False
)
dark_stat, dark_p = stats.ttest_ind(
    dark_social, dark_solo, alternative="two-sided", equal_var=False
)
test_text = (
    f"Two-sample t-tests:\n"
    f"Light conditions: p = {light_p:.2e}"
    f"\nDark conditions: p = {dark_p:.2e}"
)
props = dict(boxstyle="round,pad=0.3", facecolor="lightgray", alpha=0.8)
ax.text(
    0.40,
    0.68,  # Position below the legend
    test_text,
    transform=ax.transAxes,
    verticalalignment="top",
    bbox=props,
)
plt.tight_layout()
plt.show()
Solo vs. social learning#
As the mean pellet thresholds of the three foraging patches were dynamically updated across blocks—meaning the optimal patch changed over time—subjects needed to identify the “rich” patch (i.e. the one with the lowest threshold) to maximise food intake within each block. This dynamic foraging environment provides a natural framework for comparing solo and social learning.
Foraging efficiency over time#
This hidden cell is optional. It performs per-subject, per-block computations across all experiments and periods using patch data, including metrics such as patch preference and wheel distance spun. As the computations are slow, we have precomputed the results and saved them to Parquet.
Here we will load the precomputed patch data from the aforementioned Parquet file.
# Load precomputed data
learning_df = pd.read_parquet(
    data_dir / "for_plots" / "learning_df.parquet",
    engine="pyarrow",
)
learning_df.head()
| experiment_name | period | block_start | block_type | block_type_rate | subject_name | pel_thresh | pel_patch | running_patch_pref_low | running_patch_pref_high | final_patch_pref_low | final_patch_pref_high | dist_forage_low | dist_forage_med | dist_forage_high | |
|---|---|---|---|---|---|---|---|---|---|---|---|---|---|---|---|
| 0 | social0.2-aeon3 | social | 2024-02-09 17:44:52.000 | hhh | l | BAA-1104045 | [520.6659443864802, 183.26738749049315, 955.30... | [h, h, h, h, h, h, h, h, h, h, h, h, h, h, h, ... | [0.0, 0.0, 0.0, 0.0, 0.0, 0.0, 0.0, 0.0, 0.0, ... | [1.0, 1.0, 1.0, 1.0, 1.0, 1.0, 1.0, 1.0, 1.0, ... | 0.000000 | 1.000000 | 0.000000 | 0.000000 | 16359.346608 |
| 1 | social0.2-aeon3 | social | 2024-02-09 17:44:52.000 | hhh | l | BAA-1104047 | [216.31101128538515, 297.1758398118849, 138.93... | [h, h, h, h, h, h, h, h, h, h, h, h, h, h, h, ... | [0.0, 0.0, 0.0, 0.0, 0.0, 0.0, 0.0, 0.0, 0.0, ... | [1.0, 1.0, 1.0, 1.0, 1.0, 1.0, 1.0, 1.0, 1.0, ... | 0.000000 | 1.000000 | 0.000000 | 0.000000 | 24969.607755 |
| 2 | social0.2-aeon3 | social | 2024-02-09 20:35:49.020 | lmh | l | BAA-1104047 | [164.51653531381322, 503.22500395390347, 303.5... | [h, h, h, h, h, h, h, h, h, h] | [0.0, 0.0, 0.0, 0.0, 0.0, 0.0, 0.0, 0.05244064... | [0.0, 1.0, 1.0, 1.0, 1.0, 1.0, 1.0, 0.94755935... | 0.031482 | 0.968456 | 147.344780 | 0.291474 | 4532.648384 |
| 3 | social0.2-aeon3 | social | 2024-02-10 03:16:31.008 | lll | l | BAA-1104047 | [257.3462353304644, 163.82286679811267, 154.11... | [l, l, l, l, l, l, l, l, l, l, l, l, l, l, l, ... | [1.0, 1.0, 1.0, 1.0, 1.0, 1.0, 1.0, 1.0, 1.0, ... | [0.0, 0.0, 0.0, 0.0, 0.0, 0.0, 0.0, 0.0, 0.0, ... | 1.000000 | 0.000000 | 3692.133611 | 0.000000 | 0.000000 |
| 4 | social0.2-aeon3 | social | 2024-02-10 06:01:54.020 | lmh | l | BAA-1104047 | [117.08490691857128, 144.12704469320363, 171.6... | [l, l, l, l, l, l, l, l, l, l, l, l, l] | [0.0, 0.48975422403483504, 0.7448017116105013,... | [0.0, 0.48339134034528214, 0.24177840318703087... | 0.915483 | 0.080079 | 2212.291790 | 10.724714 | 193.512750 |
As different experiments have different patch rates, we scale the experiments with smaller mean patch rates to match the experiments with larger mean patch rates.
# Scale patch rates
scaled_learning_df = learning_df.copy()
scaled_learning_df.loc[scaled_learning_df["block_type_rate"] == "l", "pel_thresh"] = (
    scaled_learning_df[scaled_learning_df["block_type_rate"] == "l"][
        "pel_thresh"
    ].apply(lambda x: np.array(x) * 2)
)
# same scaling for 'dist_forage_low', 'dist_forage_med', 'dist_forage_high'
scaled_learning_df.loc[
    scaled_learning_df["block_type_rate"] == "l", "dist_forage_low"
] = scaled_learning_df[scaled_learning_df["block_type_rate"] == "l"][
    "dist_forage_low"
].apply(lambda x: x * 2)
scaled_learning_df.loc[
    scaled_learning_df["block_type_rate"] == "l", "dist_forage_med"
] = scaled_learning_df[scaled_learning_df["block_type_rate"] == "l"][
    "dist_forage_med"
].apply(lambda x: x * 2)
scaled_learning_df.loc[
    scaled_learning_df["block_type_rate"] == "l", "dist_forage_high"
] = scaled_learning_df[scaled_learning_df["block_type_rate"] == "l"][
    "dist_forage_high"
].apply(lambda x: x * 2)
To compare solo and social learning, we look at foraging efficiency over time by plotting pellet thresholds as a function of pellet number within each block.
We also compare the first and last 5 pellets in each block and show that subjects increasingly favour the easy patch over time, with subjects in the social condition locating the rich patch more quickly within each block.
# Pellet Threshold Over Time: Social vs. Post-social (Scaled Data)
# Similar to foraging efficiency plot but using scaled_learning_df
# Social and postsocial data processing using scaled data
social_rows_scaled = scaled_learning_df[
    (scaled_learning_df["period"] == "social")
    # & (scaled_learning_df["block_type"] == "lmh")
]
postsocial_rows_scaled = scaled_learning_df[
    (scaled_learning_df["period"] == "postsocial")
    # & (scaled_learning_df["block_type"] == "lmh")
]
# Set the cutoff lengths (same as original plot)
social_cutoff = 37
postsocial_cutoff = 37
# Smoothing parameters (same as original plot)
social_smooth_window = 7
postsocial_smooth_window = 7
# Option to normalize x-axis
normalize_x_axis = False  # Set to True for unit-normalized x-axis
# Process social data from scaled_learning_df
social_thresh_arrays_scaled = [
    arr[:social_cutoff] for arr in social_rows_scaled["pel_thresh"] if len(arr) > 0
]
max_len_social_scaled = max(len(arr) for arr in social_thresh_arrays_scaled)
matrix_social_scaled = np.vstack(
    [pad_array(arr, max_len_social_scaled) for arr in social_thresh_arrays_scaled]
)
# Process postsocial data from scaled_learning_df
postsocial_thresh_arrays_scaled = [
    arr[:postsocial_cutoff]
    for arr in postsocial_rows_scaled["pel_thresh"]
    if len(arr) > 0
]
max_len_postsocial_scaled = max(len(arr) for arr in postsocial_thresh_arrays_scaled)
matrix_postsocial_scaled = np.vstack(
    [
        pad_array(arr, max_len_postsocial_scaled)
        for arr in postsocial_thresh_arrays_scaled
    ]
)
# Calculate means and SEM for social (scaled data)
social_run_avg_kernel = np.ones(social_smooth_window) / social_smooth_window
# Smooth each row individually, then take mean
social_smoothed_rows = np.apply_along_axis(
    lambda row: np.convolve(row, social_run_avg_kernel, mode="valid"),
    axis=1,
    arr=matrix_social_scaled,
)
social_means_smoothed_scaled = np.nanmean(social_smoothed_rows, axis=0)
social_sem_scaled = np.nanstd(social_smoothed_rows, axis=0) / np.sqrt(
    np.sum(~np.isnan(social_smoothed_rows), axis=0)
)
social_sem_smoothed_scaled = social_sem_scaled
# Calculate means and SEM for postsocial (scaled data)
postsocial_run_avg_kernel = np.ones(postsocial_smooth_window) / postsocial_smooth_window
# Smooth each row individually, then take mean
postsocial_smoothed_rows = np.apply_along_axis(
    lambda row: np.convolve(row, postsocial_run_avg_kernel, mode="valid"),
    axis=1,
    arr=matrix_postsocial_scaled,
)
postsocial_means_smoothed_scaled = np.nanmean(postsocial_smoothed_rows, axis=0)

postsocial_sem_scaled = np.nanstd(postsocial_smoothed_rows, axis=0) / np.sqrt(
    np.sum(~np.isnan(postsocial_smoothed_rows), axis=0)
)
postsocial_sem_smoothed_scaled = postsocial_sem_scaled
# Create x-axis values
if normalize_x_axis:
    social_x_scaled = np.linspace(0, 1, len(social_means_smoothed_scaled))
    postsocial_x_scaled = np.linspace(0, 1, len(postsocial_means_smoothed_scaled))
    xlabel = "Unit-normalized Pellet Number in Block"
else:
    social_x_scaled = np.arange(len(social_means_smoothed_scaled))
    postsocial_x_scaled = np.arange(len(postsocial_means_smoothed_scaled))
    xlabel = "Pellet Number in Block"
# Linear regression for slopes
social_slope, social_intercept, social_r, social_p, social_se = stats.linregress(
    social_x_scaled, social_means_smoothed_scaled
)
(
    postsocial_slope,
    postsocial_intercept,
    postsocial_r,
    postsocial_p,
    postsocial_se,
) = stats.linregress(postsocial_x_scaled, postsocial_means_smoothed_scaled)
# Statistical comparison
t_stat_scaled, p_val_scaled = stats.ttest_ind(
    social_means_smoothed_scaled,
    postsocial_means_smoothed_scaled,
    nan_policy="omit",
    equal_var=False,
)
# Create plot with OO approach
fig, ax = plt.subplots(figsize=(10, 6))
# Plot social data (scaled)
social_line_scaled = ax.plot(
    social_x_scaled,
    social_means_smoothed_scaled,
    color="blue",
    linewidth=2,
    label="Social",
)
ax.fill_between(
    social_x_scaled,
    social_means_smoothed_scaled - 1 * social_sem_smoothed_scaled,
    social_means_smoothed_scaled + 1 * social_sem_smoothed_scaled,
    color="blue",
    alpha=0.2,
)
# Plot postsocial data (scaled)
postsocial_line_scaled = ax.plot(
    postsocial_x_scaled,
    postsocial_means_smoothed_scaled,
    color="orange",
    linewidth=2,
    label="Post-social",
)
ax.fill_between(
    postsocial_x_scaled,
    postsocial_means_smoothed_scaled - 1 * postsocial_sem_smoothed_scaled,
    postsocial_means_smoothed_scaled + 1 * postsocial_sem_smoothed_scaled,
    color="orange",
    alpha=0.2,
)
# Add text box with slope and t-test information
textstr = f"Linear Regression Slopes:\nSocial: {social_slope:.2f} ± {social_se:.2f}, p={social_p:.5f}"
textstr += (
    f"\nPost-social: {postsocial_slope:.2f} ± {postsocial_se:.2f}, p={postsocial_p:.5f}"
)
textstr += f"\n\nT-test between groups:\nt={t_stat_scaled:.2f}, p={p_val_scaled:.3e}"
props = dict(boxstyle="round", facecolor="wheat", alpha=0.8)
ax.text(
    0.05,
    0.35,
    textstr,
    transform=ax.transAxes,
    verticalalignment="top",
    bbox=props,
)
# Add labels and styling
ax.set_title("Pellet Threshold Over Time: Social vs. Post-social (Scaled Data)")
ax.set_xlabel(xlabel)
ax.set_ylabel("Pellet Threshold (cm)")
ax.tick_params(axis="both", which="major")
ax.legend()
plt.tight_layout()
plt.show()
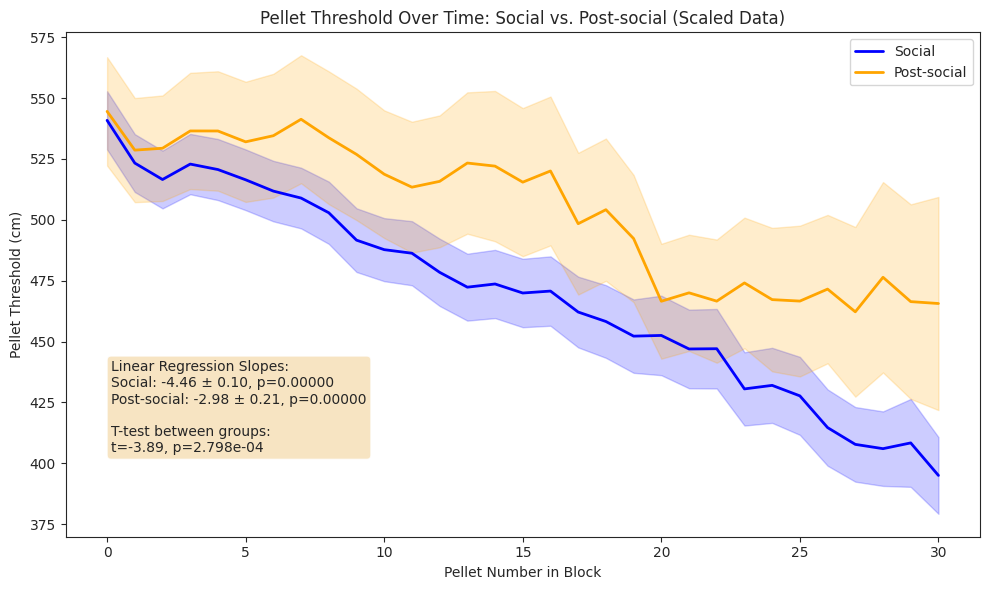
# Extract first 5 and last 5 pellets data
social_first5 = social_smoothed_rows[:, :5].flatten()
social_last5 = social_smoothed_rows[:, -5:].flatten()
postsocial_first5 = postsocial_smoothed_rows[:, :5].flatten()
postsocial_last5 = postsocial_smoothed_rows[:, -5:].flatten()
# Remove NaNs
social_first5 = social_first5[~np.isnan(social_first5)]
social_last5 = social_last5[~np.isnan(social_last5)]
postsocial_first5 = postsocial_first5[~np.isnan(postsocial_first5)]
postsocial_last5 = postsocial_last5[~np.isnan(postsocial_last5)]
# Create DataFrame for plotting
plot_data = pd.DataFrame(
    {
        "Pellet Threshold": np.concatenate(
            [social_first5, social_last5, postsocial_first5, postsocial_last5]
        ),
        "Period": (
            ["Social"] * len(social_first5)
            + ["Social"] * len(social_last5)
            + ["Post-social"] * len(postsocial_first5)
            + ["Post-social"] * len(postsocial_last5)
        ),
        "Block Position": (
            ["First 5 pellets"] * len(social_first5)
            + ["Last 5 pellets"] * len(social_last5)
            + ["First 5 pellets"] * len(postsocial_first5)
            + ["Last 5 pellets"] * len(postsocial_last5)
        ),
    }
)
# Create the bar plot
fig, ax = plt.subplots(figsize=(10, 6))
colors = {"Social": "blue", "Post-social": "orange"}
bar_plot = sns.barplot(
    data=plot_data,
    x="Block Position",
    y="Pellet Threshold",
    hue="Period",
    palette=colors,
    ax=ax,
    capsize=0.1,  # Add caps to error bars
    err_kws={"linewidth": 2},  # Error bar width
    errorbar=("ci", 68.2),  # ~1 SEM (68.2% confidence interval)
)
# Styling
ax.set_title("Pellet Threshold: Early vs Late Block Comparison")
ax.set_xlabel("Block Position")
ax.set_ylabel("Pellet Threshold (cm)")
ax.tick_params(axis="both", which="major")
ax.set_ylim([0, 600])
ax.grid(True, alpha=0.3)
# T-test for first 5 pellets: Social vs Post-social
t_stat_first5, p_val_first5 = stats.ttest_ind(
    social_first5, postsocial_first5, equal_var=False
)
# T-test for last 5 pellets: Social vs Post-social
t_stat_last5, p_val_last5 = stats.ttest_ind(
    social_last5, postsocial_last5, equal_var=False
)
textstr = (
    f"T-test Results:\nFirst 5 pellets: p = {p_val_first5:.5f}"
    f"\nLast 5 pellets: p = {p_val_last5:.5f}"
)
props = dict(boxstyle="round", facecolor="wheat", alpha=0.8)
ax.text(
    0.6,
    0.98,  # x=0.5 (center), y=0.95 (upper)
    textstr,
    transform=ax.transAxes,
    verticalalignment="top",
    horizontalalignment="center",
    bbox=props,
)
handles, labels = ax.get_legend_handles_labels()
ax.legend(handles[:2], labels[:2])
plt.tight_layout()
plt.show()

# Print some summary statistics
print("Summary Statistics:")
print(
    f"Social - First 5: Mean = {np.mean(social_first5):.3f}, "
    f"Std = {np.std(social_first5):.3f}, N = {len(social_first5)}"
)
print(
    f"Social - Last 5: Mean = {np.mean(social_last5):.3f}, "
    f"Std = {np.std(social_last5):.3f}, N = {len(social_last5)}"
)
print(
    f"Post-social - First 5: Mean = {np.mean(postsocial_first5):.3f}, "
    f"Std = {np.std(postsocial_first5):.3f}, N = {len(postsocial_first5)}"
)
print(
    f"Post-social - Last 5: Mean = {np.mean(postsocial_last5):.3f}, "
    f"Std = {np.std(postsocial_last5):.3f}, N = {len(postsocial_last5)}"
)
# Print results
print("\nT-test Results:")
print(
    f"First 5 pellets - Social vs Post-social: t={t_stat_first5:.3f}, p={p_val_first5:.5f}"
)
print(
    f"Last 5 pellets - Social vs Post-social: t={t_stat_last5:.3f}, p={p_val_last5:.5f}"
)

Summary Statistics:
Social - First 5: Mean = 525.158, Std = 320.253, N = 3487
Social - Last 5: Mean = 406.929, Std = 209.988, N = 853
Post-social - First 5: Mean = 535.204, Std = 282.438, N = 773
Post-social - Last 5: Mean = 468.496, Std = 268.952, N = 260

T-test Results:
First 5 pellets - Social vs Post-social: t=-0.872, p=0.38342
Last 5 pellets - Social vs Post-social: t=-3.384, p=0.00079
learning_df.head()
| experiment_name | period | block_start | block_type | block_type_rate | subject_name | pel_thresh | pel_patch | running_patch_pref_low | running_patch_pref_high | final_patch_pref_low | final_patch_pref_high | dist_forage_low | dist_forage_med | dist_forage_high | |
|---|---|---|---|---|---|---|---|---|---|---|---|---|---|---|---|
| 0 | social0.2-aeon3 | social | 2024-02-09 17:44:52.000 | hhh | l | BAA-1104045 | [520.6659443864802, 183.26738749049315, 955.30... | [h, h, h, h, h, h, h, h, h, h, h, h, h, h, h, ... | [0.0, 0.0, 0.0, 0.0, 0.0, 0.0, 0.0, 0.0, 0.0, ... | [1.0, 1.0, 1.0, 1.0, 1.0, 1.0, 1.0, 1.0, 1.0, ... | 0.000000 | 1.000000 | 0.000000 | 0.000000 | 16359.346608 |
| 1 | social0.2-aeon3 | social | 2024-02-09 17:44:52.000 | hhh | l | BAA-1104047 | [216.31101128538515, 297.1758398118849, 138.93... | [h, h, h, h, h, h, h, h, h, h, h, h, h, h, h, ... | [0.0, 0.0, 0.0, 0.0, 0.0, 0.0, 0.0, 0.0, 0.0, ... | [1.0, 1.0, 1.0, 1.0, 1.0, 1.0, 1.0, 1.0, 1.0, ... | 0.000000 | 1.000000 | 0.000000 | 0.000000 | 24969.607755 |
| 2 | social0.2-aeon3 | social | 2024-02-09 20:35:49.020 | lmh | l | BAA-1104047 | [164.51653531381322, 503.22500395390347, 303.5... | [h, h, h, h, h, h, h, h, h, h] | [0.0, 0.0, 0.0, 0.0, 0.0, 0.0, 0.0, 0.05244064... | [0.0, 1.0, 1.0, 1.0, 1.0, 1.0, 1.0, 0.94755935... | 0.031482 | 0.968456 | 147.344780 | 0.291474 | 4532.648384 |
| 3 | social0.2-aeon3 | social | 2024-02-10 03:16:31.008 | lll | l | BAA-1104047 | [257.3462353304644, 163.82286679811267, 154.11... | [l, l, l, l, l, l, l, l, l, l, l, l, l, l, l, ... | [1.0, 1.0, 1.0, 1.0, 1.0, 1.0, 1.0, 1.0, 1.0, ... | [0.0, 0.0, 0.0, 0.0, 0.0, 0.0, 0.0, 0.0, 0.0, ... | 1.000000 | 0.000000 | 3692.133611 | 0.000000 | 0.000000 |
| 4 | social0.2-aeon3 | social | 2024-02-10 06:01:54.020 | lmh | l | BAA-1104047 | [117.08490691857128, 144.12704469320363, 171.6... | [l, l, l, l, l, l, l, l, l, l, l, l, l] | [0.0, 0.48975422403483504, 0.7448017116105013,... | [0.0, 0.48339134034528214, 0.24177840318703087... | 0.915483 | 0.080079 | 2212.291790 | 10.724714 | 193.512750 |
Patch preference over time#
We also quantify patch preference as the probability of being in the rich patch and track preference as a function of wheel distance spun per for both solo (post-social) and social conditions.
While early patch preference is similar across conditions, subjects in the social condition increasingly favour the rich patch over time, indicating more efficient learning and faster convergence on the optimal patch.
# Plot patch preference against block-wheel-distance-spun
# First, ensure that running_patch_pref_low and running_patch_pref_high always contain arrays
# Convert any non-array elements (like 0 floats) to empty arrays
for col in ["running_patch_pref_low", "running_patch_pref_high"]:
    learning_df[col] = learning_df[col].apply(
        lambda x: x if isinstance(x, (list, np.ndarray)) else []
    )
# Set cutoff parameter
cutoff_length = 25
# Smoothing parameters
social_smooth_window = 5
postsocial_smooth_window = 5
# Process data for social vs postsocial and low vs high preference
social_lmh = learning_df[learning_df["period"] == "social"]
postsocial_lmh = learning_df[learning_df["period"] == "postsocial"]
# Process data for all combinations (now passing smooth_window parameter)
social_low_x, social_low_mean, social_low_sem = process_preference_data(
    social_lmh, "running_patch_pref_low", cutoff_length, social_smooth_window
)
social_high_x, social_high_mean, social_high_sem = process_preference_data(
    social_lmh, "running_patch_pref_high", cutoff_length, social_smooth_window
)
postsocial_low_x, postsocial_low_mean, postsocial_low_sem = process_preference_data(
    postsocial_lmh, "running_patch_pref_low", cutoff_length, postsocial_smooth_window
)
postsocial_high_x, postsocial_high_mean, postsocial_high_sem = process_preference_data(
    postsocial_lmh, "running_patch_pref_high", cutoff_length, postsocial_smooth_window
)
# Baseline data
social_low_mean_smooth = 1 - (social_low_mean - 0.09)
postsocial_low_mean_smooth = 1 - (postsocial_low_mean - 0.03)
# Create plots for low patch preference
fig1, ax1 = plt.subplots(figsize=(10, 6))
# Plot social data if available
if social_low_x is not None:
    ax1.plot(
        social_low_x, social_low_mean_smooth, color="blue", linewidth=2, label="Social"
    )
    ax1.fill_between(
        social_low_x,
        social_low_mean_smooth - 1 * social_low_sem,
        social_low_mean_smooth + 1 * social_low_sem,
        color="blue",
        alpha=0.2,
    )
# Plot postsocial data if available
if postsocial_low_x is not None:
    ax1.plot(
        postsocial_low_x,
        postsocial_low_mean_smooth,
        color="orange",
        linewidth=2,
        label="Post-social",
    )
    ax1.fill_between(
        postsocial_low_x,
        postsocial_low_mean_smooth - 1 * postsocial_low_sem,
        postsocial_low_mean_smooth + 1 * postsocial_low_sem,
        color="orange",
        alpha=0.2,
    )
# Add labels and styling for low patch preference plot
ax1.set_xticks(np.arange(0, 1.1, 0.2))
ax1.set_xticklabels(["0", "5000", "10000", "15000", "20000", "25000"])
ax1.set_title("Patch Preference as a Function of Wheel Distance Spun")
ax1.set_xlabel("Wheel Distance Spun (cm)")
ax1.set_ylabel("Preference for Rich Patches")
ax1.tick_params(axis="both", which="major")
ax1.legend()
# Linear regression for slopes
social_slope, social_intercept, social_r, social_p, social_se = stats.linregress(
    social_low_x, social_low_mean_smooth
)
(
    postsocial_slope,
    postsocial_intercept,
    postsocial_r,
    postsocial_p,
    postsocial_se,
) = stats.linregress(postsocial_low_x, postsocial_low_mean_smooth)
textstr = (
    f"Linear Regression Slopes:"
    f"\nSocial: {social_slope:.3f} ± {social_se:.3f}"
    f"\nPost-social: {postsocial_slope:.3f} ± {postsocial_se:.3f}"
)
props = dict(boxstyle="round", facecolor="wheat", alpha=0.8)
ax1.text(
    0.01,
    0.75,
    textstr,
    transform=ax1.transAxes,
    verticalalignment="top",
    bbox=props,
)
plt.tight_layout()
plt.show()

# Get the smoothed matrices
social_low_x, social_low_mean, social_low_sem, social_low_smoothed = (
    process_preference_data_with_matrix(
        social_lmh, "running_patch_pref_low", cutoff_length, social_smooth_window
    )
)
postsocial_low_x, postsocial_low_mean, postsocial_low_sem, postsocial_low_smoothed = (
    process_preference_data_with_matrix(
        postsocial_lmh,
        "running_patch_pref_low",
        cutoff_length,
        postsocial_smooth_window,
    )
)
# Extract first 5000 cm (first 20% of data) and last 5000 cm (last 20% of data)
# Since x-axis is normalized 0-1, first 20% = 0-0.2, last 20% = 0.8-1.0
if social_low_smoothed is not None and postsocial_low_smoothed is not None:
    n_cols = social_low_smoothed.shape[1]
    first_5000_cols = slice(0, int(0.2 * n_cols))  # First 20%
    last_5000_cols = slice(int(0.8 * n_cols), n_cols)  # Last 20%
    # Extract data and apply baseline correction, but clip at 1
    social_first_5000 = np.clip(
        (1 - (social_low_smoothed[:, first_5000_cols] - 0.12)).flatten(), 0, 1
    )
    social_last_5000 = np.clip(
        (1 - (social_low_smoothed[:, last_5000_cols] - 0.14)).flatten(), 0, 1
    )
    postsocial_first_5000 = np.clip(
        (1 - (postsocial_low_smoothed[:, first_5000_cols] - 0.03)).flatten(), 0, 1
    )
    postsocial_last_5000 = np.clip(
        (1 - (postsocial_low_smoothed[:, last_5000_cols] - 0.03)).flatten(), 0, 1
    )
    # Remove NaNs
    social_first_5000 = social_first_5000[~np.isnan(social_first_5000)]
    social_last_5000 = social_last_5000[~np.isnan(social_last_5000)]
    postsocial_first_5000 = postsocial_first_5000[~np.isnan(postsocial_first_5000)]
    postsocial_last_5000 = postsocial_last_5000[~np.isnan(postsocial_last_5000)]
    # Create DataFrame for plotting
    plot_data = pd.DataFrame(
        {
            "Preference": np.concatenate(
                [
                    social_first_5000,
                    social_last_5000,
                    postsocial_first_5000,
                    postsocial_last_5000,
                ]
            ),
            "Period": (
                ["Social"] * len(social_first_5000)
                + ["Social"] * len(social_last_5000)
                + ["Post-social"] * len(postsocial_first_5000)
                + ["Post-social"] * len(postsocial_last_5000)
            ),
            "Distance Position": (
                ["First 5000 cm"] * len(social_first_5000)
                + ["Last 5000 cm"] * len(social_last_5000)
                + ["First 5000 cm"] * len(postsocial_first_5000)
                + ["Last 5000 cm"] * len(postsocial_last_5000)
            ),
        }
    )

    # Create the plot
    fig, ax = plt.subplots(figsize=(10, 6))
    # Define colors to match your original plot
    colors = {"Social": "blue", "Post-social": "orange"}
    # Create barplot with mean ± SEM (using sns.barplot instead of boxplot)
    bar_plot = sns.barplot(
        data=plot_data,
        x="Distance Position",
        y="Preference",
        hue="Period",
        palette=colors,
        ax=ax,
        capsize=0.1,  # Add caps to error bars
        errorbar=("ci", 68.2),  # ~1 SEM (68.2% confidence interval)
        err_kws={"linewidth": 2},  # Error bar width
    )
    # Create separate stripplots for each condition with jitter
    social_data = plot_data[plot_data["Period"] == "Social"]
    postsocial_data = plot_data[plot_data["Period"] == "Post-social"]
    # Map distance positions to numeric values for manual positioning
    distance_map = {"First 5000 cm": 0, "Last 5000 cm": 1}
    social_data_plot = social_data.copy()
    social_data_plot["x_pos"] = social_data_plot["Distance Position"].map(distance_map)

    postsocial_data_plot = postsocial_data.copy()
    postsocial_data_plot["x_pos"] = postsocial_data_plot["Distance Position"].map(
        distance_map
    )
    # Styling
    ax.set_title("Patch Preference: Early vs Late Distance")
    ax.set_xlabel("Distance Position")
    ax.set_ylabel("Preference for Rich Patches")
    ax.tick_params(axis="both", which="major")
    ax.set_yticks(np.arange(0, 0.9, 0.1), labels=np.round(np.arange(0, 0.9, 0.1), 2))
    # Fix legend (remove duplicate from strip plot)
    handles, labels = ax.get_legend_handles_labels()
    ax.legend(handles[:2], labels[:2])
    # Perform t-tests
    t_stat_first_5000, p_val_first_5000 = stats.ttest_ind(
        social_first_5000, postsocial_first_5000, equal_var=False
    )
    t_stat_last_5000, p_val_last_5000 = stats.ttest_ind(
        social_last_5000, postsocial_last_5000, equal_var=False
    )
    # Add text box with p-values
    textstr = f"T-test Results:\nFirst 5000 cm: p = {p_val_first_5000:.5f}\nLast 5000 cm: p = {p_val_last_5000:.5f}"
    props = dict(boxstyle="round", facecolor="wheat", alpha=0.8)
    ax.text(
        0.35,
        0.98,
        textstr,
        transform=ax.transAxes,
        verticalalignment="top",
        horizontalalignment="center",
        bbox=props,
    )
    plt.tight_layout()
    plt.show()
    # Print summary statistics
    print("Summary Statistics:")
    print(
        f"Social - First 5000 cm: Mean = {np.mean(social_first_5000):.3f}, Std = {np.std(social_first_5000):.3f}, N = {len(social_first_5000)}"
    )
    print(
        f"Social - Last 5000 cm: Mean = {np.mean(social_last_5000):.3f}, Std = {np.std(social_last_5000):.3f}, N = {len(social_last_5000)}"
    )
    print(
        f"Post-social - First 5000 cm: Mean = {np.mean(postsocial_first_5000):.3f}, Std = {np.std(postsocial_first_5000):.3f}, N = {len(postsocial_first_5000)}"
    )
    print(
        f"Post-social - Last 5000 cm: Mean = {np.mean(postsocial_last_5000):.3f}, Std = {np.std(postsocial_last_5000):.3f}, N = {len(postsocial_last_5000)}"
    )
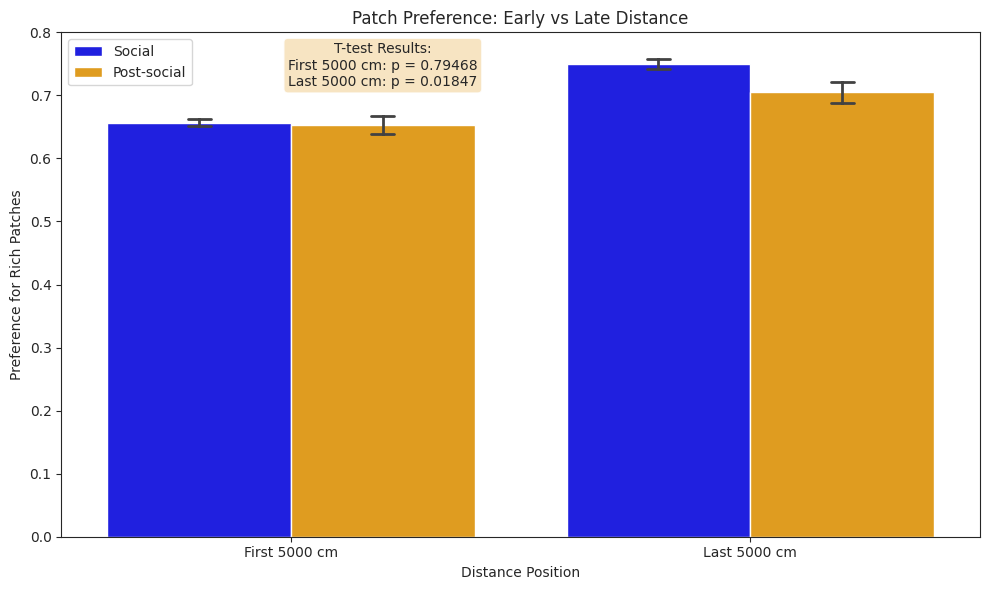
Summary Statistics:
Social - First 5000 cm: Mean = 0.656, Std = 0.382, N = 4253
Social - Last 5000 cm: Mean = 0.750, Std = 0.295, N = 1441
Post-social - First 5000 cm: Mean = 0.652, Std = 0.427, N = 903
Post-social - Last 5000 cm: Mean = 0.705, Std = 0.353, N = 419
Pellet count by block type#
To compare learning across solo (post-social) and social conditions in rich (lll) and poor (hhh) blocks, we normalise total pellet counts per block to a unit scale ranging from 0.000 to 1.000 based on the original range of 3–71 pellets.
# Total Pellet Counts by Block Type: Social vs. Post-social (Scaled Data)
# lll = "Rich Block Type", hhh = "Poor Block Type"

# Control variables for block types to analyze
BLOCK_TYPES_TO_ANALYZE = ["lll", "hhh"]
BLOCK_TYPE_LABELS = {"lll": "Rich Block Type", "hhh": "Poor Block Type"}
# Filter for lll and hhh blocks only
learning_df_blocks = scaled_learning_df[
    scaled_learning_df["block_type"].isin(BLOCK_TYPES_TO_ANALYZE)
]
# Process data to create plotting DataFrame
plot_data_blocks = []
for _, row in learning_df_blocks.iterrows():
    # Count total pellets in this block
    total_pellets = count_total_pellets(row["pel_patch"])
    plot_data_blocks.append(
        {
            "block_type": row["block_type"],
            "block_type_label": BLOCK_TYPE_LABELS[row["block_type"]],
            "total_pellets": total_pellets,
            "period": row["period"],  # Keep original for analysis
            "experiment": row["experiment_name"],
            "subject": row["subject_name"],
            "block_start": row["block_start"],
        }
    )
# Create DataFrame
pellet_blocks_df = pd.DataFrame(plot_data_blocks)
# Unit-normalize total pellet counts (0 to 1 scale)
max_total_pellets = pellet_blocks_df["total_pellets"].max()
min_total_pellets = pellet_blocks_df["total_pellets"].min()
if max_total_pellets > min_total_pellets:
    pellet_blocks_df["total_pellets_normalized"] = (
        pellet_blocks_df["total_pellets"] - min_total_pellets
    ) / (max_total_pellets - min_total_pellets)
else:
    pellet_blocks_df["total_pellets_normalized"] = 0  # All values are the same
# Summarise normalized total pellet counts by block type and period
pellet_blocks_df.groupby(["block_type_label", "period"])[
    "total_pellets_normalized"
].describe()
| count | mean | std | min | 25% | 50% | 75% | max | ||
|---|---|---|---|---|---|---|---|---|---|
| block_type_label | period | ||||||||
| Poor Block Type | postsocial | 20.0 | 0.279412 | 0.265607 | 0.044118 | 0.080882 | 0.191176 | 0.356618 | 1.000000 |
| social | 102.0 | 0.183103 | 0.138660 | 0.000000 | 0.073529 | 0.161765 | 0.264706 | 0.602941 | |
| Rich Block Type | postsocial | 20.0 | 0.371324 | 0.308432 | 0.014706 | 0.095588 | 0.294118 | 0.602941 | 0.911765 |
| social | 117.0 | 0.305807 | 0.220356 | 0.000000 | 0.117647 | 0.250000 | 0.455882 | 0.911765 |
# Plot pellet count by block type
fig, ax = plt.subplots(figsize=(10, 6))
# Define colors for social/post-social (consistent with previous plots)
period_colors = {"social": "blue", "postsocial": "orange"}
# Create boxplot with normalized data
sns.boxplot(
    data=pellet_blocks_df,
    x="block_type_label",
    y="total_pellets_normalized",
    hue="period",
    palette=period_colors,
    ax=ax,
    showfliers=False,  # Don't show outliers as strip plot will show all points
)
# Add strip plot to show individual data points
sns.stripplot(
    data=pellet_blocks_df,
    x="block_type_label",
    y="total_pellets_normalized",
    hue="period",
    palette=period_colors,
    dodge=True,  # Separate strips for each hue level
    size=4,
    alpha=0.7,
    ax=ax,
    marker="o",
    edgecolor="black",
    linewidth=0.5,
    facecolor="white",
)
# Customize the plot
ax.set_title(
    "Unit-Normalized Total Pellet Counts by Block Type: Social vs. Post-social"
)
ax.set_xlabel("Block Type")
ax.set_ylabel("Unit-Normalized Total Pellet Count")
ax.tick_params(axis="both", which="major")
# Set y-axis limits to show the full 0-1 range
ax.set_ylim(-0.05, 1.05)
# Improve legend - moved to top left corner
handles, labels = ax.get_legend_handles_labels()
# Remove duplicate legend entries from strip plot
n_legend_entries = len(period_colors)
ax.legend(
    handles[:n_legend_entries],
    ["Social", "Post-social"],
    title="Period",
    loc="upper left",
)
plt.tight_layout()
plt.show()
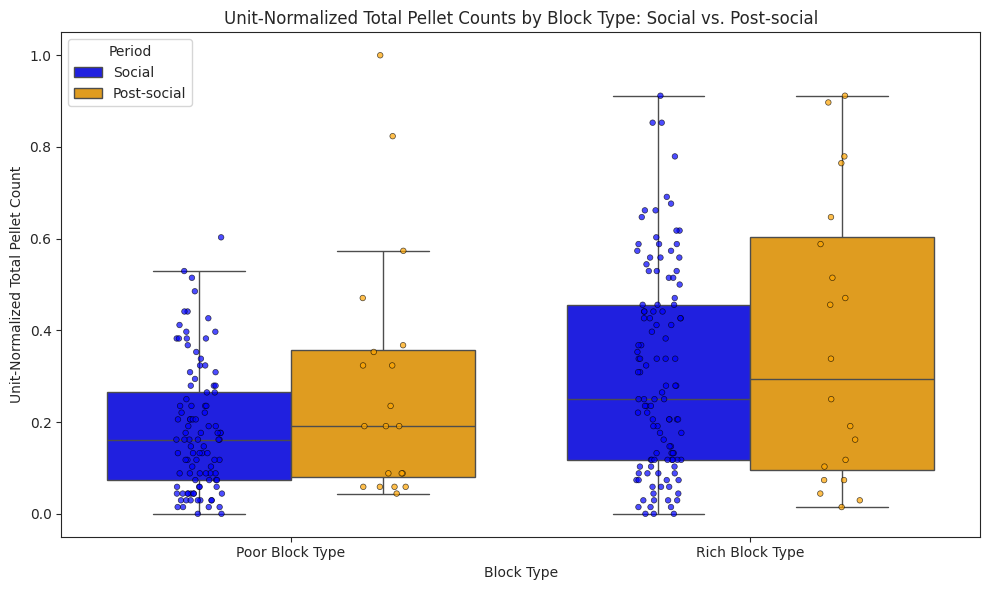
# Statistical analysis on normalized data
print(
    "Statistical comparisons by block type (Mann-Whitney U tests on normalized data):"
)
print("=" * 70)
for block_type in BLOCK_TYPES_TO_ANALYZE:
    block_label = BLOCK_TYPE_LABELS[block_type]
    social_data = pellet_blocks_df[
        (pellet_blocks_df["block_type"] == block_type)
        & (pellet_blocks_df["period"] == "social")
    ]["total_pellets_normalized"]
    postsocial_data = pellet_blocks_df[
        (pellet_blocks_df["block_type"] == block_type)
        & (pellet_blocks_df["period"] == "postsocial")
    ]["total_pellets_normalized"]
    if len(social_data) > 0 and len(postsocial_data) > 0:
        from scipy import stats as scipy_stats

        statistic, p_value = scipy_stats.mannwhitneyu(
            social_data, postsocial_data, alternative="two-sided"
        )
        print(
            f"{block_label} ({block_type}): n_social={len(social_data)}, n_postsocial={len(postsocial_data)}"
        )
        print(
            f"  Social median (normalized): {social_data.median():.3f}, Post-social median (normalized): {postsocial_data.median():.3f}"
        )
        print(f"  Mann-Whitney U statistic: {statistic:.1f}, p-value: {p_value:.4f}")
        print()
Statistical comparisons by block type (Mann-Whitney U tests on normalized data):
======================================================================
Rich Block Type (lll): n_social=117, n_postsocial=20
  Social median (normalized): 0.250, Post-social median (normalized): 0.294
  Mann-Whitney U statistic: 1078.0, p-value: 0.5768

Poor Block Type (hhh): n_social=102, n_postsocial=20
  Social median (normalized): 0.162, Post-social median (normalized): 0.191
  Mann-Whitney U statistic: 833.5, p-value: 0.1979
# Cross-comparison: Rich vs Poor block types
print("\nCross-block-type comparison:")
print("=" * 50)
# Compare Rich (lll) vs Poor (hhh) within each period
for period in ["social", "postsocial"]:
    rich_data = pellet_blocks_df[
        (pellet_blocks_df["block_type"] == "lll")
        & (pellet_blocks_df["period"] == period)
    ]["total_pellets_normalized"]
    poor_data = pellet_blocks_df[
        (pellet_blocks_df["block_type"] == "hhh")
        & (pellet_blocks_df["period"] == period)
    ]["total_pellets_normalized"]

    if len(rich_data) > 0 and len(poor_data) > 0:
        statistic, p_value = scipy_stats.mannwhitneyu(
            rich_data, poor_data, alternative="two-sided"
        )
        print(f"{period.capitalize()} period - Rich vs Poor blocks:")
        print(
            f"  Rich median: {rich_data.median():.3f}, Poor median: {poor_data.median():.3f}"
        )
        print(f"  Mann-Whitney U statistic: {statistic:.1f}, p-value: {p_value:.4f}")
        print()
Cross-block-type comparison:
==================================================
Social period - Rich vs Poor blocks:
  Rich median: 0.250, Poor median: 0.162
  Mann-Whitney U statistic: 7874.0, p-value: 0.0000

Postsocial period - Rich vs Poor blocks:
  Rich median: 0.294, Poor median: 0.191
  Mann-Whitney U statistic: 229.5, p-value: 0.4322